Website Analytics November 2017
Website analytics provides insight into who is visiting the website with details of traffic patterns, demographics and technology used. This tool provides the information to create and maintain an effective website.
Analytics are provided on a monthly basis.
Overview
373,371 individuals visited the site
784,193 visits were made by the individuals above
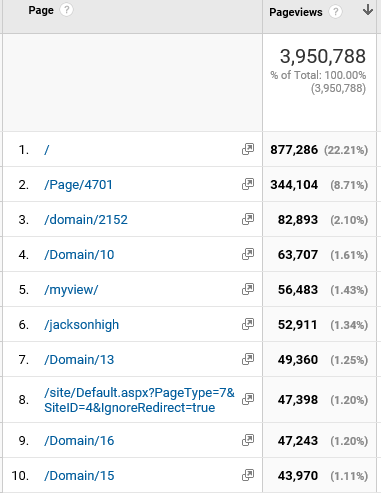
3,950,788 pages were viewed during those visits
40.27% of the visitors were new to the site.
The average number of pages visited on each visit was 5.04.
The average time spent on each page was 02:30 .
Most visits came from the following countries:
1. United States
2. Canada
3. India
4. Philippines
5. United Kingdom
6. Japan
7. Mexico
8. Ukraine
9. South Korea
10. Italy
People who prefer to view the web with a different language have a setting on their computers that the analytic tool can read. The top five languages preferences that were not a variant of English (US, AU, UK) were:
1. Spanish
2. Korean
3. Chinese
4. Russian
5. Vietnamese
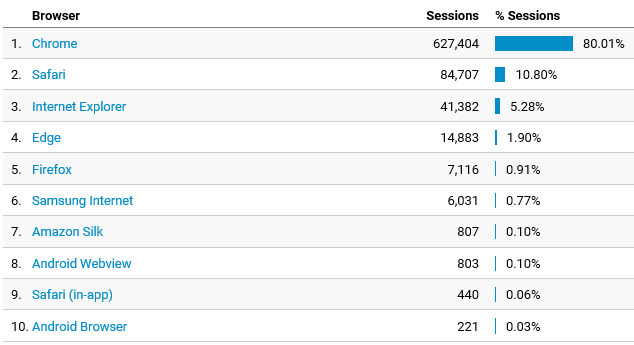
Browsers
This data shows that Chrome is the most popular browser.
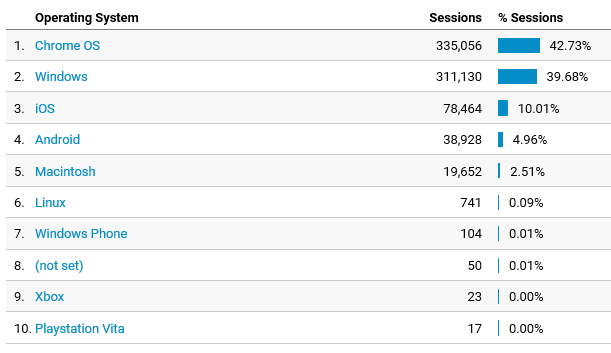
Operating System
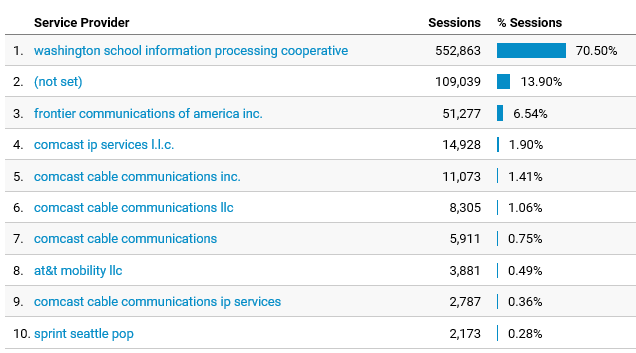
Service Providers
This tells us what provider the visitor is using.
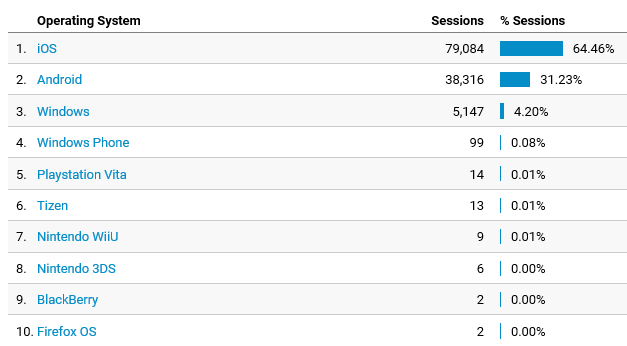
Mobile Operating Systems
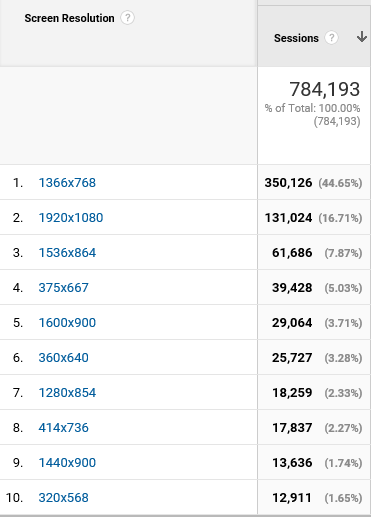
Overall Screen Resolution
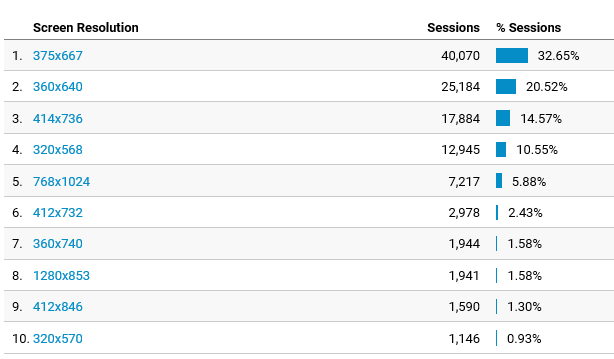
Mobile Screen Resolution
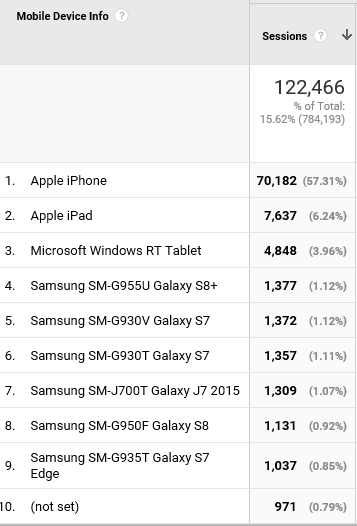
Mobile Devices
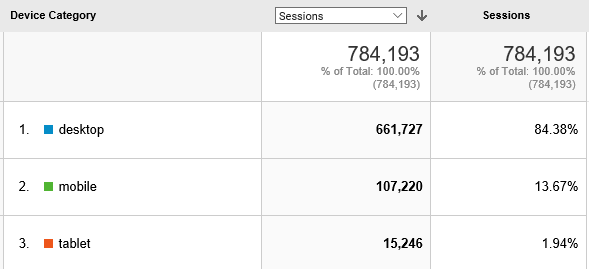
Device Category
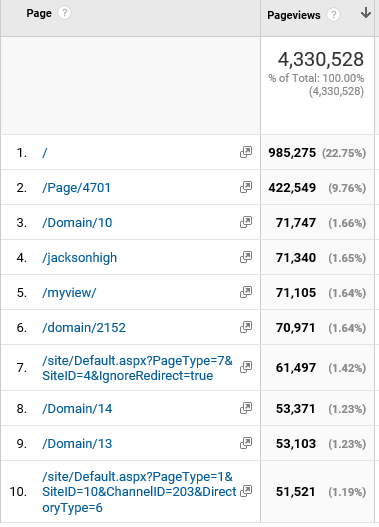
Most visited pages
Heatherwood Directory
North Middle
Login page
Gateway Midlle
Student Tools
Jackson High
MyView (must login to see)
Jackson High
LMS welcome page
District home page