A Component of the Washington State Assessment Program
WASL Washington Assessment
of Student Learning
A Component of the Washington State Assessment Program
Using Results to Improve
Student Learning
Science Grade 8
Released Scenarios and Items 2003

Published by the Science Assessment Team of the Washington Office of the Superintendent of Public Instruction on July 12, 2003
Copyright © 2003 by Washington Office of the Superintendent of Public Instruction (OSPI)
All rights reserved. Educational institutions within the State of Washington have permission to reproduce this document. All other individuals wishing to reproduce this document must contact OSPI.
Table of Contents
Letter from the Superintendent 2
Introduction to the Science Released Scenarios and Items 3
How to Use this Released Item Booklet and the Item Analysis Report 4
What do the Scores on the Science WASL Mean? 5
Using this Data to Improve Instruction and Student Achievement 5
Using Released Items as Professional Development Opportunities 7
Bubble vs. Chewing Gum: A life science inquiry scenario with 6 items
Scenario Summary 8
Scenario 9
Items 1 – 3: Multiple choice items with characteristics and data 10
Items 4 & 5: Short answer items with characteristics and data 13
Scoring rubric and value point data
Annotated student responses
Item 6: Extended response item with characteristics and data 25
Scoring rubric and value point data
Annotated student responses
Roller Coaster: A physical science inquiry scenario with 4 items
Scenario Summary 45
Scenario 46
Items 7 – 10: Multiple choice items with characteristics and data 47
Item 11: Short answer items with characteristics and data 54
Scoring rubric and value point data
Annotated student responses
August 1, 2003
Dear Washington State Educators:
I am delighted to offer this third annual released test item publication from the 2003
Washington Assessment of Student Learning (WASL). My staff worked hard to be able to release this material in time for your use in administration workshops and LID day trainings for all staff. This publication is designed to assist teachers and administrators in the analysis of the results of specific test items in order to identify patterns, trends, weaknesses, and strengths of student performance on the Essential Academic Learning Requirements (EALRs).
The writing prompts and annotations from the Spring 2003 WASL will be available electronically on the OSPI website, as will released science pilot items for grade 5.
As a teacher, or as a district or building administrator, you will be able to analyze the actual test items and the data that accompany them to learn more about students in your school and district. You will be able to compare the performance of your school to your district or the state. By analyzing the differences in the data and the relationship that each question has with the EALRs, you will be able to identify areas where performance is strong and areas for improvement in your school and district. I fervently hope opportunities will be provided prior to the start of the school year for principals and teachers to work with the item-specific scoring rubrics in listening, reading, mathematics, and science and the annotated student responses that illustrate each score point. This experience will help schools work more effectively with students and parents this fall and throughout the school year.
OSPI hopes that you will use the information to begin a thoughtful, impassioned dialogue about what we expect our students to know and be able to do and how well they need to do it. We expect that this material will initiate conversations among administrators, faculty, students, and parents as to how this information can impact our teaching, our learning, and our communication. Plans to improve student learning should not be made based on these results alone. It is important to also include the results from other assessments used by the teacher, school, and/or district.
In November, OSPI assessment staff will again conduct regional training on the effective use of these materials.
Have a wonderful and successful school year as we continue our work toward improving student achievement in the 21st century. I encourage you to search our newly updated website, www.k12.wa.us , for further resources to guide your instructional practices.
Sincerely,
Dr. Terry Bergeson
State Superintendent of Public Instruction
Introduction to the Science Released Scenarios and Items
We are delighted to offer these released scenarios and items from the first operational science WASL given in the spring of 2003. This release booklet contains two scenarios with associated items and one stand-alone item: about 25% of the exam. Release booklets are designed to assist teachers and administrators in understanding how the science WASL measures students’ achievement of the science EALRs.
The science WASL is composed of scenarios modeling the three themes of the science EALRs: systems (including properties, structure and changes), inquiry, and design as shown below in our science EALR graphic. Students’ scores are reported in five strands: properties of systems, structure of systems, changes in systems, inquiry in science, and designing solutions.
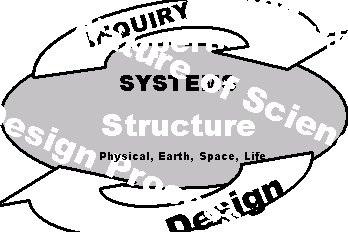 Systems scenarios describe a familiar system including some inputs, outputs,
and transfers of matter, energy, and/or information. Students are asked to
demonstrate their understanding of the system and what might happen as part of
the system changes. About forty percent of the exam involves measuring systems
learning targets.
Systems scenarios describe a familiar system including some inputs, outputs,
and transfers of matter, energy, and/or information. Students are asked to
demonstrate their understanding of the system and what might happen as part of
the system changes. About forty percent of the exam involves measuring systems
learning targets.
Inquiry scenarios describe a scientific investigation. Students are asked about the attributes of the investigation, asked to write conclusions, to make predictions, and how to deal with nature of science issues such as inconsistencies. Often students are asked to plan a new investigation similar to the scenario’s
investigation. About forty percent of the exam involves measuring inquiry learning targets. Both of the scenarios in this year’s release are descriptions of an investigation.
Design scenarios describe how a solution to a human problem or challenge was designed. Students are asked about the system being ‘fixed’ or manipulated and the use of scientific concepts and/or data in the solution. Often students are asked to describe how a solution could be designed for a new problem or challenge similar to the one described in the scenario. About twenty percent of the exam involves measuring design learning targets.
In addition to this booklet, there are many other instructionally supportive materials available for the science WASL including these released scenarios made into mini-science WASLs. To access these resources, please go to the OSPI website ( www.k12.wa.us ) and click to the science assessment webpage.
If you have any questions or ideas, please contact Roy Q. Beven at rbeven@ospi.wednet.edu.
Sincerely,
![]()
Roy Q. Beven, OSPI Science Assessment Specialist
How to Use this Released Item Booklet
and the Item Analysis Report
Introduction:
You should have two documents: this Released Item Booklet and the Item Analysis Report. These two documents should be used together to help administrators and teachers understand and use released science WASL scenarios and items to assess and improve student achievement of the specific learning strands and targets (benchmark indicators) of the Science EALRs.
This Released Item Booklet includes the following information:
- WASL science scenarios and items from the 2003 operational exam
- A table for each item where you can enter the school-level, district-level, and state-level data information for that item
- Information to indicate the strand, learning target, and item characteristic for each item
- Item-specific scoring rubrics, sample student responses at each score point, and annotations for each student response explaining how the score was derived
The Item Analysis Report includes the following information:
- A list of all released items referenced to strands and learning targets
- Data on student responses to multiple-choice items including the percentage of students who responded to each possible answer by school, district, and state. Correct answers have asterisks.
- Data for constructed-response items (short answer and extended response) is presented by the percentage of students who scored at each score point by school, district, and state.
-
 Data for the “planning an investigation” extended response (4-point)
item is presented in terms of up to ten value points by school, district, and
state. The attributes of a scientific investigation are assigned value points
that are used to derive the student’s item score.
Data for the “planning an investigation” extended response (4-point)
item is presented in terms of up to ten value points by school, district, and
state. The attributes of a scientific investigation are assigned value points
that are used to derive the student’s item score.
To Interpret Your Data:
- First, transfer your data from the Item Analysis Report to the Released Item Booklet. Transfer all the information for each item into each table so that you will have all the information in one place.
- Second, examine the item types to determine the strengths and weaknesses in student performance in your school or district. Do the students perform well on multiple-choice items? Constructed-response items? What percentage of students in a school or district left constructed-response items blank or earned a zero?
- Third, examine the data by strand and learning targets. Group together targets that represent strengths and weaknesses for the students in a school or a district. Do the targets all fit under one particular strand or do they belong to several strands?
- Fourth, look for trends. Do the students in your school perform markedly lower or markedly higher on a particular item in comparison to the students in the district or the state?
What do the Scores on the Science WASL Mean?
Like all the WASLs, the 8th grade science WASL measures what all students should know and be able to do in science by the spring of their 8 th grade year. The science WASL does not measure student understanding developed in one course or one school year. The science WASL measures students’ understanding of science concepts and processes developed from Kindergarten through 8th grade.
The items on the science WASL measure the learning targets (benchmark indicators) of the science EALRs. These learning targets are organized into the five reported strands: three systems strands, an inquiry strand, and a design strand. Thus the strand scores indicate how well students understand the learning targets of that strand.
Using this Data to Improve Instruction and Student Achievement
To add meaning to the strand scores, science educators should establish where their classrooms and school systems provide students the opportunity to build understanding of the science learning targets associated with each strand. To improve student learning, determine how to refine the instructional activities that are intended to build understanding of the learning targets of each strand.
Teachers:
If you teach 6th, 7th , or 8th grade science, look at your school results in the reported strands. Then look at the strand’s learning targets pertinent to your class. Consider the instructional activities your students have experienced in your class and in their K-5 experience. Ask yourself, “How could I improve my students’ learning of those targets?”
For example: Suppose you are low in the Inquiry in Science strand (the green pages of the color-coded science EALRs available on the science assessment webpage).
- Study the ‘Bubble vs. Chewing Gum’ scenario in this booklet and compare the inquiry items to the ten learning targets in the Inquiry in Science strand of the science EALRs.
- In the ‘General Characteristics of the Science WASL’ or the ‘ Test and Item Specifications of the Science WASL,’ you will find a page that describes the 16 questions generally asked about science inquiry. Consider how your course helps students show their understanding of inquiry in science as measured by these questions.
- Talk with the teachers of science in grades K through 8. Find out how the Inquiry in Science learning targets are being developed in earlier grades. Then plan how you can build on what students have experienced and learned.
- Learn how to make your written assessments WASL-like (scenario-based, EALR-focused exams) by attending science assessment workshops offered by your school, district, ESD, or OSPI in conjunction with the Science Assessment Leadership Team.
Using this Data to Improve Instruction and Student Achievement (continued)
School and District Administrators:
As science teachers improve their own middle school classes, the school itself needs to assure that in 6th, 7th, and 8th grades, students have the opportunity to learn the science systems, inquiry and design middle school learning targets (EALR benchmark indicators).
For example: In the Changes in Systems strand there are three physical science, four Earth/space science, and three life science learning targets. If the three life science learning targets are well developed in a particular grade or course, where do students have the opportunity to learn the seven other learning targets of that strand? Remember that classes that focus upon a particular science (i.e. Earth science) can provide students the opportunity to build understanding of learning targets in the other sciences as well.
As a middle school refines the science experience for all students, school districts need to assure students entering middle school have had the opportunity to learn the elementary school science systems, inquiry, and design learning targets.
The state funds a program that can help implement a standards-based K-8 science program. This program is called Leadership and Assistance in Science Educational Reform (LASER). For information about LASER, contact Eric Wuersten, OSPI Science Curriculum Supervisor at ewuerten@ospi.wednet.edu or (360) 725- 6311.
Using Released Items as Professional Development Opportunities
Key Goals of Professional Development Opportunities
Key Goals of Professional Development Opportunities
- Develop understanding of the themes of the science EALRs
- Develop understanding of the science WASL, the data it provides, and the relationship between the WASL data and classroom instruction
- Develop a deeper understanding of how to objectively score student responses in science
Half-Day Professional Development
- Use this release booklet and follow guidelines for “How to Use this Released Item Booklet and Item Analysis Report”. Depending on configuration of the participating group, complete data for grades 8 and 10 or just do grade specific data.
- Provide data analysis from the 2003 released items and ask, “Where do we see areas that need further improvement?” and “What instructional practices can improve student learning in those areas?” Formulate questions based on the work you have done in the school and/or district.
- Compare science WASL assessment results with other school and/or district assessments to further define areas in which to focus instruction.
- Contact your district or region’s science assessment leaders and ask them to use the General Characteristics of the Science WASL and accompanying PowerPoint presentation to facilitate understanding and discussion of the science EALRs and WASL.
Full-Day Professional Development
- Complete the suggestions for Half-Day Professional Development
- Contact your district or region’s science assessment leaders to receive more in depth training on the Scoring Student Responses on the Science WASL packets that contain instructions and a full set of anchor and practice papers with annotations for the released items.
Follow-Up Professional Development Involving Students
- Have teachers build scenarios with items as end-of-unit assessments using the Planning WASL-like Assessments in Science (available in 2004) and share the assessments with their peers before using them.
- Use WASL-like scenarios to assess students at the end of an instructional unit then teach the students how to score their own responses.
-
Bring teachers together with their student’s assessments and ask, “
What do the results tell us?” Lay out the unit of study and ask, “How
can we modify this unit to build appropriate understanding of the targeted
science learning targets?”
2003 Released Science Scenario with Items
Bubble vs. Chewing Gum Summary
| Title: Bubble vs. Chewing Gum | Grade: 8 |
| Description: Students investigate how much mass is lost from gum after it is chewed. Assuming the mass lost is caused by sugar being removed while chewing, students think that the bubble gum will lose the most mass because it seems to be the sweetest. |
Item Descriptor |
EALR Strand, Learning Target,
and Item Characteristic
|
Item Type |
Properties of Systems
|
Structure
of Systems |
Changes in Systems
|
Inquiry
in Science |
DesigningSolutions
|
Multiple Choice |
Short Answer |
Extended Response
|
|
1
| Identify a controlled variable (kept the same) in an investigation. | IN02
2.1.2
d |
D |
2
| Identify the responding variable (dependent) in an investigation. | IN02
2.1.2
e |
C |
3
| Identify how repeating an investigation improves the validity of the results. |
IN09
2.2.9
c |
D |
4
| Write a conclusion to an investigation. |
IN03
2.1.3
a |
SA |
|
5
| Describe how not keeping a variable the same might affect the validity of an investigation. |
IN09
2.2.9
e |
SA |
|
6
| Plan a second investigation for a different investigative question that can be answered using a similar plan. |
IN02
2.1.2
a |
ER |
| Note: Scenarios should have items measuring more than one EALR Strand | Total
|
3 |
2 | 1
|
|
Ideal Totals
| 3-6
| 1-2
|
0-1 |
Bubble vs. Chewing Gum
Bubble vs. Chewing Gum
Directions: Use the following information to answer numbers 1 through 6.
Libby thought that bubble gum must have more sugar than chewing gum. Both types of gum lose sugar (mass) after chewing. With this information in mind, Libby did the following investigation.
Question:
How does chewing affect the mass of bubble and chewing gum?
Prediction (Hypothesis):
The bubble gum will have less mass after chewing because bubble gum has more sugar than chewing gum.
Materials:
3 three-gram pieces of bubble gum (all the same brand)
3 three-gram pieces of chewing gum (all the same brand)
balance to measure mass
stopwatch
Procedure:
- Chew a three-gram piece of bubble gum for 15 seconds.
- Measure the mass of the chewed bubble gum and record.
- Repeat steps 1 and 2 for chewing gum.
- Repeat steps 1, 2, and 3 two more times with each type of gum.
Type of Gum and Mass Lost
Type of
Gum |
Mass (grams) | Mass Lost
(grams) |
Before |
After | Loss
| Average Loss
| |
Bubble |
3.00 | 1.50
| 1.50
| 1.47
|
Bubble |
3.00 | 1.70
| 1.30
| |
|
Bubble | 3.00
| 1.40
| 1.60
| |
|
Chewing | 3.00
| 1.00
| 2.00
|
2.00 |
Chewing |
3.00 | 0.90
| 2.10
| |
|
Chewing | 3.00
| 1.10
| 1.90
|
Bubble vs. Chewing Gum
Bubble vs. Chewing Gum
1 In Libby’s investigation, which variable was controlled (kept the same)?
- A. Number of chews
- B. Type of gum chewed
- C. Mass of gum after chewing
- D. Mass of gum before chewing
Item information
Correct Response: D
EALR Strand: IN Inquiry in Science
Learning Target: IN02 2.1.2 Planning and Conducting Investigations
Plan, conduct, and evaluate scientific investigations, using appropriate equipment, mathematics, and safety procedures.
Item Characteristic: d: Given a complete description of an investigation, items may ask students to identify one controlled variable (kept the same).
Performance Data Use the space below to fill in student performance information for your school, your district, and state.
Item 1 Percent Distribution of Responses
|
Item 1
Responses
* correct response |
School |
District | State
| |
|
A | |||
B | |||
C
| |||
*D | |||
NR
(No Response) |
Bubble vs. Chewing Gum
Bubble vs. Chewing Gum
2 In Libby’s investigation, which of the following variables was the responding variable(dependent)?
- A. Type of gum chewed
- B. Length of time chewed
- C. Mass of gum after chewing
- D. Mass of gum before chewing
Item information
Correct Response: C
EALR Strand: IN Inquiry in Science
Learning Target: IN02 2.1.2 Planning and Conducting Investigations
Plan, conduct, and evaluate scientific investigations, using appropriate equipment, mathematics, and safety procedures.
Item Characteristic: e: Given a complete description of an investigation, items may ask students to identify the responding (dependent) variable.
Performance Data Use the space below to fill in student performance information for your school, your district, and state.
Item 2 Percent Distribution of Responses
|
Item 2
Responses
* correct response |
School |
District | State
| |
|
A | |||
B | |||
*C
| |||
D | |||
NR
(No Response) |
Bubble vs. Chewing Gum
Bubble vs. Chewing Gum
3 What could Libby do to be sure the results of her investigation were valid?
- A. Change gum types
- B. Research the gum
- C . Change the variables
- D. Repeat her investigation
Item information
Correct Response: D
EALR Strand: IN Inquiry in Science
Learning Target: IN09 2.2.9 Evaluating Methods of Investigation
Analyze and explain the factors that affect physical and chemical changes and how matter and energy are conserved in a closed system.
Item Characteristic: c: Given an investigation plan and/or results, items may ask students to identify how repeating an investigation improves the validity of the results.
Performance Data Use the space below to fill in student performance information for your school, your district, and state.
Item 3 Percent Distribution of Responses
|
Item 3
Responses
* correct response |
School |
District | State
| |
|
A | |||
B | |||
C
| |||
*D | |||
NR
(No Response) |
Bubble vs. Chewing Gum
Bubble vs. Chewing Gum
4 Write a conclusion that answers the investigative question.
Be sure to:
- Include data from the table.
- Explain how the data supports your conclusion.
Bubble vs. Chewing Gum
Bubble vs. Chewing Gum
4 (continued)
Item information:
Score Points: 2
EALR Strand: IN Inquiry in Science
Learning Target: IN03 2.1.3 Explaining
Use evidence from scientific investigations to think critically and logically to develop descriptions, explanations, and predictions.
Item Characteristic: a: Given a completed investigation, items may ask students to write a conclusion.
Performance Data Use the space below to fill in student performance information for your school, your district, and state.
Item 4 Percent Distribution of Score Points
|
Item 4
Score Points |
School |
District | State
| |
|
0 | |||
1 | |||
2
| |||
NR
(No Response) | |||
|
Mean |
Bubble vs. Chewing Gum
Bubble vs. Chewing Gum
Scoring Rubric for item number 4:
A 2-point response: The student shows the ability to use evidence from scientific investigations to think critically and logically to develop explanations (conclusions).
The student concludes that, after chewing, chewing gum has lost more mass than bubble gum and provides evidence from the data table for support.
Example:
Chewing gum lost more mass than bubble gum after chewing. Chewing gum lost an average of 0.53 grams more than bubble gum.
A 1-point response: The student shows some ability to use evidence from scientific investigations to think critically and logically to develop explanations (conclusions).
The student correctly concludes that chewing gum lost more mass than bubble gum but a reference to supporting data is vague or nonspecific.
OR
The student includes appropriate supporting data, but the conclusion incorrectly answers the investigative question.
A 0-point response: The student shows little or no ability to use evidence from scientific investigations to think critically and logically to develop explanations (conclusions).
The student correctly states that chewing gum has lost more mass than bubble gum but the supporting data is misused or misrepresented.
Bubble vs. Chewing Gum
Annotated Example of a 2-point response for item number 4:
4 Write a conclusion that answers the investigative question.
Be sure to:
- Include data from the table.
- Explain how the data supports your conclusion.
| Which losses more mass, bubble gum or chewing gum? Chewing gum |
| lost more mass because it had an average loss of 2.00 grams and |
| the bubble gum had an average loss of 1.47 grams. Both types |
| started out with three grams each. |
Annotation:
This response demonstrates that the student shows ability to use evidence from scientific investigations to think critically and logically to develop explanations (conclusions).
The response states, ”Chewing gum lost more mass” than bubble gum (1 point).
The response explains, using data from the table, how the data supports the conclusion (1 point).
Bubble vs. Chewing Gum
Bubble vs. Chewing Gum
Annotated Example of a 1-point response for item number 4:
4 Write a conclusion that answers the investigative question.
Be sure to:
- Include data from the table.
- Explain how the data supports your conclusion.
| On average the chewing gum lost more mass than the bubble gum. |
| The hypothesis was wrong and the chewing gum has more sugar. |
| Each piece started out the same and each time the chewing gum |
| lost more mass than the bubble gum. |
Annotation:
This response demonstrates that the student shows some ability to use evidence from scientific investigations to think critically and logically to develop explanations (conclusions).
The response states, ”On average the chewing gum lost more mass than the bubble gum” (1 point).
The response vaguely refers to the data table but does not include any data in the explanation
(0 point).
Bubble vs. Chewing Gum
Bubble vs. Chewing Gum
Annotated Example of a 0-point response for item number 4:
4 Write a conclusion that answers the investigative question.
Be sure to:
- Include data from the table.
- Explain how the data supports your conclusion.
| I think that bubble gum and chewing gum both have the same |
| amount because in the graph it says in before chewing bubble gum |
| and chewing gum both have 3.00 grams of mass |
Annotation:
This response demonstrates that the student shows little to no ability to use evidence from scientific investigations to think critically and logically to develop explanations (conclusions).
The response draws an incorrect conclusion (0 point) and includes data from the beginning of the investigation (0 point).
Bubble vs. Chewing Gum
Bubble vs. Chewing Gum
5 Michael noticed that Libby was not chewing the gum the same way each trial. Why might this variable be important to the validity of Libby’s investigation?
Be sure to state:
- How chewing the gum could vary.
- How this variable might affect the mass of the gum after chewing.
Bubble vs. Chewing Gum
Bubble vs. Chewing Gum
5 (continued)
Item information:
Score Points: 2
EALR Strand: IN Inquiry in Science
Learning Target: IN09 2.2.9 Evaluating Methods of Investigation
Describe how methods of investigation relate to the validity of scientific experiments, observations, theoretical models, and explanation.
Item Characteristic: e: Given an investigation plan and/or results, items may ask students to describe how not keeping a variable the same might affect the validity of an investigation.
Performance Data Use the space below to fill in student performance information for your school, your district, and state.
Item 5 Percent Distribution of Score Points
|
Item 5
Score Points |
School |
District | State
| |
|
0 | |||
1 | |||
2
| |||
NR
(No Response) | |||
|
Mean |
Bubble vs. Chewing Gum
Bubble vs. Chewing Gum
Scoring Rubric for item number 5:
A 2-point response: The student shows the ability to describe how methods of investigation relate to the validity of scientific investigation.
The student describes one way that the chewing process can vary and how that variable affects the mass of the gum after chewing. Variables that will affect the mass of the gum after chewing may include but are not limited to the following:
- chewing more frequently or harder
- using front teeth or back teeth
- chewing with more or less saliva.
Example:
The gum could be chewed more frequently or harder. If it is chewed more frequently or harder, the mass will be less.
A 1-point response: The student shows some ability to describe how methods of investigation relate to the validity of scientific investigation.
The student completely describes either the chewing variable or the chewing variable’s effect on the mass of the gum.
OR
The student partially describes both mass and chewing variable.
A 0-point response: The student shows little or no understanding of how methods of investigation relate to the validity of scientific investigation.
Note: The term weight can be used for mass because this item is measuring an inquiry learning target not the systems concepts of weight and mass.
Bubble vs. Chewing Gum
Bubble vs. Chewing Gum
Annotated Example of a 2-point response for item number 5:
5 Michael noticed that Libby was not chewing the gum the same way each trial. Why might this variable be important to the validity of Libby’s investigation?
Be sure to state:
- How chewing the gum could vary.
- How this variable might affect the mass of the gum after chewing.
| If Libby had chewed non-stop during her first trial, then chewed a |
| little slower/less in the next trial, the piece of gum that was first |
| chewed would probably have a smaller mass after being chewed for |
| 15 seconds because the more the gum is chewed, the more sugar is |
| reducted from that piece. |
Annotation:
This response demonstrates that the student shows the ability to describe how methods of investigation relate to the validity of scientific investigations.
The response describes how chewing could vary, ”non-stop … little slower/less” (1 point).
The response explains how this variance could affect the mass of gum, “ the more sugar is reducted from that piece” (1 point). Note that the interesting word “ reducted ” is read to mean reduced or lost and that sugar is taken to indicate mass.
Bubble vs. Chewing Gum
Bubble vs. Chewing Gum
Annotated Example of a 1-point response for item number 5:
5 Michael noticed that Libby was not chewing the gum the same way each trial. Why might this variable be important to the validity of Libby’s investigation?
Be sure to state:
- How chewing the gum could vary.
- How this variable might affect the mass of the gum after chewing.
| When Libby is chewing she could be chewing hard for 15 seconds |
| on the first piece of gum and on the second type of gum she could |
| be chewing softly therefor the results would be different. |
Annotation:
This response demonstrates that the student shows some ability to describe how methods of investigation relate to the validity of scientific investigations.
The response describes how chewing could vary, ”chewing hard … chewing softly”
(1 point).
The response does not explain how this variance could affect the mass of gum. The statement, “ the results would be different” is too vague to credit (0 point).
Bubble vs. Chewing Gum
Bubble vs. Chewing Gum
Annotated Example of a 0-point response for item number 5:
5 Michael noticed that Libby was not chewing the gum the same way each trial. Why might this variable be important to the validity of Libby’s investigation?
Be sure to state:
- How chewing the gum could vary.
- How this variable might affect the mass of the gum after chewing.
| The chewing could vary by the gum getting softer or she could have |
| a different amount of gum. If there is more gum it might get |
| harder faster |
Annotation:
This response demonstrates that the student shows little or no ability to describe how methods of investigation relate to the validity of scientific investigations.
The response describes how the gum could vary but not how the chewing of the gum could vary (0 point).
The response also states, “ If there is more gum it might get harder faster” which does not address the mass of the gum after chewing (0 point).
Bubble vs. Chewing Gum
Bubble vs. Chewing Gum
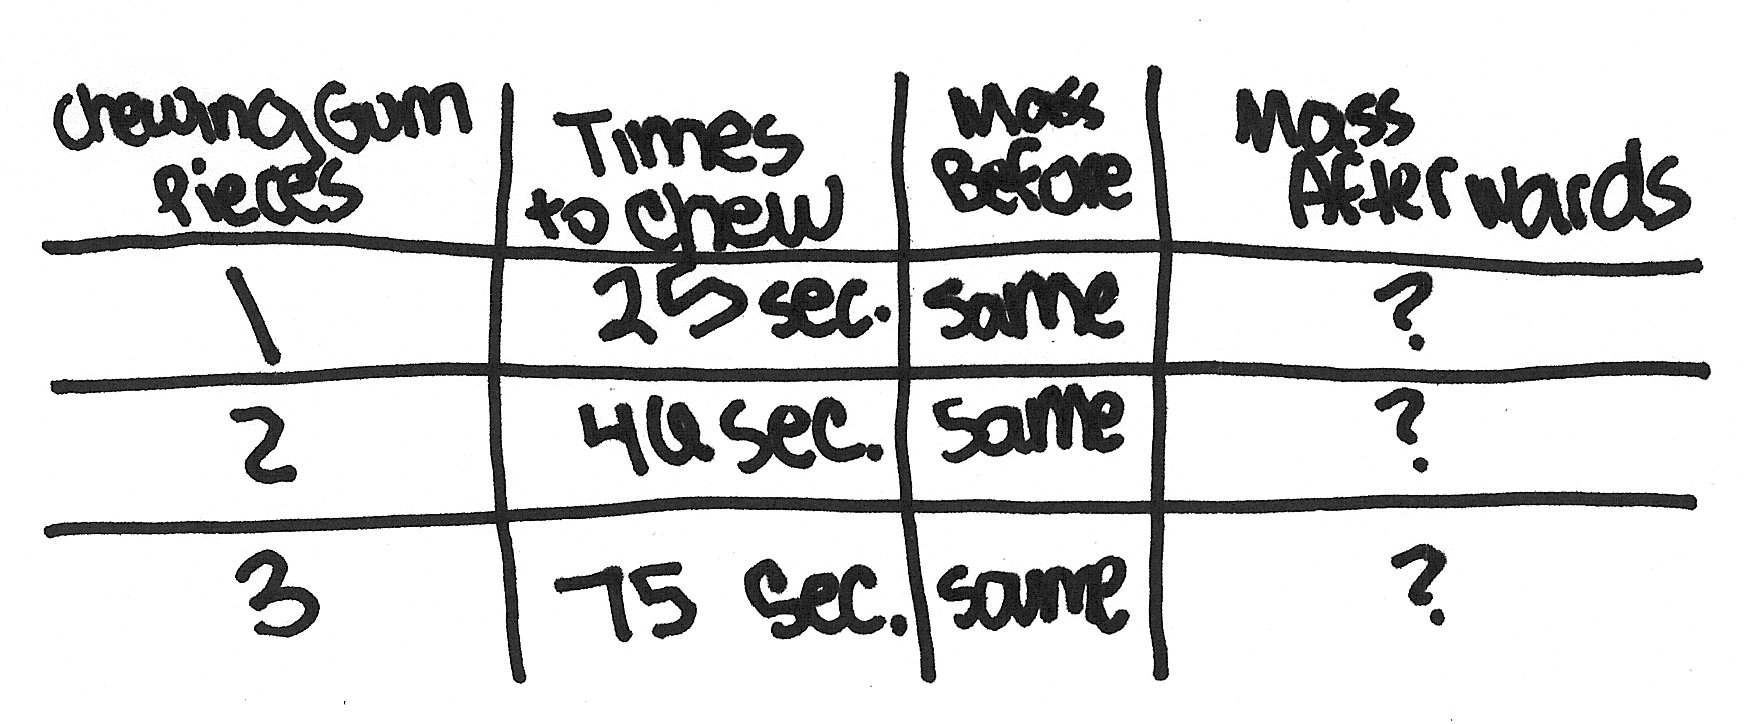
6 Libby wondered just how quickly chewing gum loses its sugar (mass) while chewing. She asked, “How does the chewing time affect the mass lost by chewing gum?” Plan an investigation to answer Libby’s question.
Be sure to include:
- Prediction (hypothesis) of the investigation results
- Materials needed to perform the investigation
- Procedure that includes:
- logical steps to perform the investigation
- one controlled variable (kept the same)
- one variable that is manipulated (changed)
- one responding variable (dependent)
- how often measurements are taken and recorded
Use words, labeled pictures, and/or labeled diagrams in your response.
| Question: How does the chewing time affect the mass lost by chewing gum? |
| Prediction: |
| Materials: |
Bubble vs. Chewing Gum
Bubble vs. Chewing Gum
6 (continued)
You may use the space below for a labeled diagram to support your procedure.
| Procedure: |
Bubble vs. Chewing Gum
Bubble vs. Chewing Gum
6 (continued)
Item information
Score points: 4
EALR Strand: IN Inquiry in Science
Learning Target: IN02 2.1.2 Planning and Conducting Investigations
Plan, conduct, and evaluate scientific investigations, using appropriate equipment, mathematics, and safety procedures.
Item Characteristic: a: Given a description of a scientific investigation and investigation results, items may ask students to plan a second investigation for a different investigative question that can be answered using a similar plan.
Performance Data Use the space below to fill in student performance information for your school, your district, and state.
Item 6 Percent Distribution of Score Points
|
Item 6
Score Points |
School |
District | State
| |
|
0 | |||
1 | |||
2
| |||
3 | |||
4
| |||
NR
(No Response) | |||
|
Mean |
Bubble vs. Chewing Gum
Bubble vs. Chewing Gum
Scoring Rubric for Item 6
A 4-point response: The student shows the ability to plan a scientific investigation. The student plans an investigation that earns 7-9 value points.
Prediction: 1 value point for a prediction that is related to the investigative question and includes both the manipulated variable (chewing time) and responding variable (mass of the gum after chewing).
Reason for Prediction: Though giving a reason for the prediction is not expected at this level, 1 value point may be awarded for a reason for the prediction such as “The longer the gum is chewed, the less the gum’s mass because chewing takes out the sugar.”
(Note: At this level, a prediction, which is supported by any reason, justifies the ‘prediction reason’ value point.)
Materials: 1 value point for listing at least gum, balance, and stop watch
Procedure: (up to 6 value points, 1 value point per bulleted feature)
Expected:
- At least one controlled variable (kept the same) is identified or implied such as one type of gum, the chewing rate, or the way the gum is massed
- The time of chewing is identified or implied as the only manipulated (changed) variable.
- The mass of gum after chewing is identified or implied as the responding (dependent) variable.
- Repeated trials (more than one) are planned to measure the responding variable.
- Measurements are recorded periodically throughout the investigation without creating artificial data.
- The steps of the investigation are logical with enough detail to repeat the procedure effectively.
Notes
- The investigation may be planned to test chewing time or chewing rate.
- If the procedure is not appropriate for the given investigative question, none of the 6 procedure value points can be awarded.
-
If the procedure indicates only one measurement is taken, no points can be
awarded for controlled or manipulated variables because there is no chance to
change or keep constant any variable.
Bubble vs. Chewing Gum
Bubble vs. Chewing Gum
Scoring Rubric for Item 6 (continued)
A 3-point response: The student shows some ability to plan a scientific investigation. The student plans an investigation that earns 5-6 value points.
A 2-point response: The student shows limited ability to plan a scientific investigation. The student plans an investigation that earns 3-4 value points.
A 1-point response: The student shows very little ability to plan a scientific investigation. The student plans an investigation that earns 1-2 value points.
A 0-point response: The student shows almost no ability to plan a scientific investigation. The student plans an investigation that earns 0 value points.
Performance Data Use the space below to fill in student performance information for your school, your district, and state.
Item 6 Percent Distribution of Value Points |
Item 6 Value Point Investigation Attributes |
School |
District | State
| |
|
Prediction | |||
Prediction Reason | |||
Materials | |||
Controlled Variable | |||
Manipulated Variable | |||
Responding Variable | |||
Repeated Trials | |||
Record Measurements | |||
Logical Steps |
Bubble vs. Chewing Gum
Bubble vs. Chewing Gum
Annotated Example of a 4-point response for item 6:
6 Libby wondered just how quickly chewing gum loses its sugar (mass) while chewing. She asked, “How does the chewing time affect the mass lost by chewing gum?” Plan an investigation to answer Libby’s question.
Be sure to include:
- Prediction (hypothesis) of the investigation results
- Materials needed to perform the investigation
- Procedure that includes:
- logical steps to perform the investigation
- one controlled variable (kept the same)
- one variable that is manipulated (changed)
- one responding variable (dependent)
- how often measurements are taken and recorded
Use words, labeled pictures, and/or labeled diagrams in your response.
| Question: How does the chewing time affect the mass lost by chewing gum? |
| Prediction: The more one chews, the more sugar is lost, and the less |
| mass there is |
| Materials: The following materials are needed: |
|
|
|
Bubble vs. Chewing Gum
Annotated Example of a 4-point response for item 6: (continued)
You may use the space below for a labeled diagram to support you procedure.
 |
| Procedure: First, I am going to decide that for every different |
| piece of gum, I will chew for a different amount of time. So for |
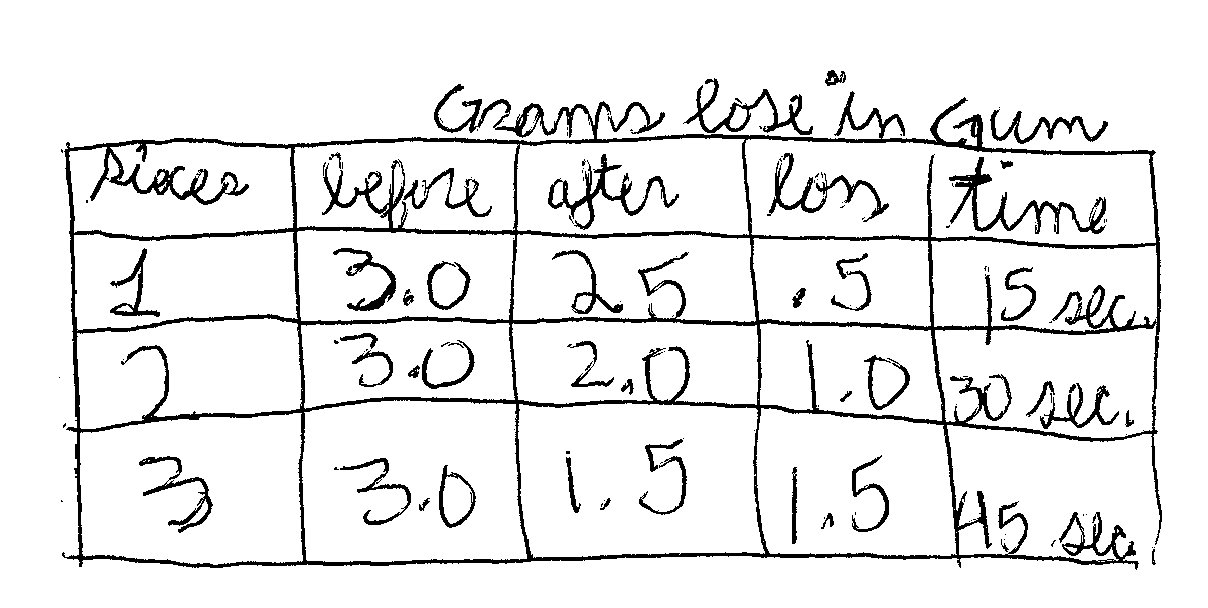
| the times, I will chew 25 seconds, 75 seconds, and 46 seconds. |
| Then, I would time the time I chewed for one piece of gum, and |
| measure the mass afterwards. I would repeat this step for the |
| other two pieces of gum, and record my results. |
Bubble vs. Chewing Gum
Bubble vs. Chewing Gum
Annotation for the sample 4-point response for item 6:
This response demonstrates that the student shows the ability to plan a scientific investigation. The response was awarded 8 value points for 4 score points.
- A prediction related the question is given, “the more one chews, …, the less mass there is” (1 point). The reason for prediction is implied in the prediction, “the more sugar is lost” (1 point) .
- All the needed materials are listed (1 point).
- One controlled variable is credited for the mass of the gum before because, in the materials list, the gum is listed as “ 3 pieces of the same chewing gum with the same mass” (1 point).
- The manipulated variable is implied: 15, 46, and 75 seconds (1 point).
- The responding variable is implied, “measure the mass afterwards” (1 point).
- Measurements are recorded, “record my results” (1 point).
- The steps of the investigation are logical with enough detail to repeat the procedure effectively (1 point).
-
Repeating the trials was not indicated (no points).
Bubble vs. Chewing Gum
Bubble vs. Chewing Gum
Annotated Example of a 3-point response for item 6:
6 Libby wondered just how quickly chewing gum loses its sugar (mass) while chewing. She asked, “How does the chewing time affect the mass lost by chewing gum?” Plan an investigation to answer Libby’s question.
Be sure to include:
- Prediction (hypothesis) of the investigation results
- Materials needed to perform the investigation
- Procedure that includes:
- logical steps to perform the investigation
- one controlled variable (kept the same)
- one variable that is manipulated (changed)
- one responding variable (dependent)
- how often measurements are taken and recorded
Use words, labeled pictures, and/or labeled diagrams in your response.
| Question: How does the chewing time affect the mass lost by chewing gum? |
| Prediction: The longer the gum is chewed the less mass it will have |
| Materials: |
|
|
|
Bubble vs. Chewing Gum
Annotated Example of a 3-point response for item 6: (continued)
You may use the space below for a labeled diagram to support you procedure.
| Procedure: |
|
|
|
|
|
|
|
Bubble vs. Chewing Gum
Bubble vs. Chewing Gum
Annotation for the sample 3-point response for item 6:
This response demonstrates that the student shows some ability to plan a scientific investigation. The response was awarded 6 value points for 3 score points.
- A prediction related the question is given, “The longer the gum is chewed the less mass it will have” (1 point). No reason for prediction is given (no point).
- All the needed materials are listed (1 point).
- One controlled variable is credited for the brand of the gum because, in the materials list, the gum is listed as “ 3 pieces of the same chewing gum (all the same brand)” (1 point).
- The manipulated variable is implied: 15, 30, and 45 seconds (1 point).
- The responding variable is implied, “measure the mass” (1 point).
- Measurements are not recorded (0 points).
- The steps of the investigation are logical with enough detail to repeat the procedure effectively (1 point).
-
Repeating the trials was not indicated (no point).
Bubble vs. Chewing Gum
Bubble vs. Chewing Gum
Annotated Example of a 2-point response for item number 6:
6 Libby wondered just how quickly chewing gum loses its sugar (mass) while chewing. She asked, “How does the chewing time affect the mass lost by chewing gum?” Plan an investigation to answer Libby’s question.
Be sure to include:
- Prediction (hypothesis) of the investigation results
- Materials needed to perform the investigation
- Procedure that includes:
- logical steps to perform the investigation
- one controlled variable (kept the same)
- one variable that is manipulated (changed)
- one responding variable (dependent)
- how often measurements are taken and recorded
Use words, labeled pictures, and/or labeled diagrams in your response.
| Question: How does the chewing time affect the mass lost by chewing gum? |
| Prediction: That you take sugar a lot in the first few minutes and |
| then you take it out little by little |
| Materials: |
| Stopwatch |
| 3 three gram pieces of Chewing gum |
| Balance to measure mass |
Bubble vs. Chewing Gum
Annotated Example of a 2-point response for item 6: (continued)
You may use the space below for a labeled diagram to support you procedure.
 |
| Procedure: The first step you could take is measureing the mass of |
| the piece of gum before its chewed. Then you would chew one |
| piece by about 15 seconds, another by 30 seconds, and another by |
| 45 seconds. A controlled variable in this would be how much gum |
| weighed before it was chewed. A variable that is manipulated is |
| the lossage. A responding variable is the time or how long it was |
| chewed. Measurements were taken every 15 seconds until it |
| reached 45 seconds. |
Bubble vs. Chewing Gum
Bubble vs. Chewing Gum
Annotation for the sample 2-point response for item 6:
This response demonstrates that the student shows limited ability to plan a scientific investigation. The response was awarded 3 value points for 2 score points.
- The prediction given does not mention mass (0 points). The statement does describe a possible rate of sugar loss, which could be taken as a reason for a prediction. However, without a prediction, the reason cannot be attributed (no point).
- All the needed materials are listed (1 point).
- One controlled variable is credited for mass of the gum before, in the materials list, the gum is listed as “ 3 three gram pieces of chewing gum” and, in the data table, the ‘grams’ before is listed as 3.0 (1 point).
- The manipulated variable, chewing time, is implied but the response clearly identifies the mass lost, “A variable that is manipulated is the lossage.” The response indicates a misunderstanding of this attribute (0 point).
- The responding variable, mass loss, is implied but the response clearly identifies the chewing time, “A responding variable is the time or how long.” The response indicates a misunderstanding of this attribute (0 point).
- The data table given normally indicates measurements are recorded but this response filled the responding variable cells with artificial data indicating a misunderstanding of this attribute (0 point).
- The steps of the investigation are logical with enough detail to repeat the procedure effectively (1 point).
- Repeating the trials was not indicated (no point).
Bubble vs. Chewing Gum
Bubble vs. Chewing Gum
Annotated Example of a 1-point response for item number 6:
6 Libby wondered just how quickly chewing gum loses its sugar (mass) while chewing. She asked, “How does the chewing time affect the mass lost by chewing gum?” Plan an investigation to answer Libby’s question.
Be sure to include:
- Prediction (hypothesis) of the investigation results
- Materials needed to perform the investigation
- Procedure that includes:
- logical steps to perform the investigation
- one controlled variable (kept the same)
- one variable that is manipulated (changed)
- one responding variable (dependent)
- how often measurements are taken and recorded
Use words, labeled pictures, and/or labeled diagrams in your response.
| Question: How does the chewing time affect the mass lost by chewing gum? |
| Prediction: Time would affect the sugar lost because the longer the |
| gum is chew the more sugare and flavor is lost. |
| Materials: You would need gum a stope watch and a ruler to |
| messure the length after it is chewed. |
Bubble vs. Chewing Gum
Annotated Example of a 1-point response for item 6: (continued)
You may use the space below for a labeled diagram to support you procedure.
| Procedure: Chew the gum for a certain amount of time. Then time |
| how long it takes to loses the sugar. Next messure the mass of |
| the gum. |
Bubble vs. Chewing Gum
Bubble vs. Chewing Gum
Annotation for the sample 1-point response for item 5:
This response demonstrates that the student shows little ability to plan a scientific investigation. The response was awarded 2 value points for 1 score point.
- A prediction related the question is given, “The longer the gum is chewed the more sugare and flavor is lost” (1 point). The word sugar can be counted as mass in this investigation because of the introduction, “Both types of gum lose sugar (mass) after chewing.” No reason for prediction is given (no point).
- The gum and the balance are missing from the materials list (0 point).
- No controlled variable can be credited because only one data point was taken (0 point).
- No manipulated variable can be credited because only one data point was taken (0 point).
- The responding variable is implied, “measure the mass of the gum” (1 point).
- Measurements are not recorded (0 point).
- The steps of the investigation are not logical enough to repeat the procedure effectively, i.e. “ certain amount of time ” is too vague to repeat (0 point).
- Repeating the trials was not indicated (no point).
Bubble vs. Chewing Gum
Bubble vs. Chewing Gum
Annotated Example of a 0-point response for item number 6:
6 Libby wondered just how quickly chewing gum loses its sugar (mass) while chewing. She asked, “How does the chewing time affect the mass lost by chewing gum?” Plan an investigation to answer Libby’s question.
Be sure to include:
- Prediction (hypothesis) of the investigation results
- Materials needed to perform the investigation
- Procedure that includes:
- logical steps to perform the investigation
- one controlled variable (kept the same)
- one variable that is manipulated (changed)
- one responding variable (dependent)
- how often measurements are taken and recorded
Use words, labeled pictures, and/or labeled diagrams in your response.
| Question: How does the chewing time affect the mass lost by chewing gum? |
| Prediction: My prediction is that chewing gum will have more sugar |
| than bubble gum. |
| Materials: 3 pieces of 3 gram chewing gum same brand, 3 pieces of |
| 3 gram bubble gum same brand, stopwatch (timer), and Balance (to |
| measure) |
Bubble vs. Chewing Gum
Annotated Example of a 0-point response for item 6: (continued)
You may use the space below for a labeled diagram to support you procedure.
| Procedure: |
|
|
|
Bubble vs. Chewing Gum
Bubble vs. Chewing Gum
Annotation for the sample 0-point response for item 6:
This response demonstrates that the student shows no ability to plan a scientific investigation. The response was awarded 0 value points for 0 score points.
- A prediction about amount of sugar in gum does not relate to the new question about chewing time and mass lost (0 point). Without a prediction, no reason for the prediction can be awarded (no point).
- The materials list is copied from the scenario and cannot be credited (0 point).
The second “Note” at the end of the scoring rubric states, “If the student does not plan an appropriate procedure for this investigative question, they cannot earn any of the 6 possible value points that are awarded for procedure.” This procedure is for the scenario’s investigative question, “How does chewing affect the mass of bubble and chewing gum?” instead of the new question, “How does the chewing time affect the mass lost by chewing gum?” This response cannot be credited with any of the points for the attributes of a procedure.
- Controlled variable (0 point).
- Manipulated variable (0 point).
- Responding variable (0 point).
- Recorded measurements (0 point).
- Logical steps (0 point).
- Repeated trials (no point).
2003 Released Science Scenario with Items
Roller Coaster Summary
| Title: Roller Coaster | Grade: 8 |
| Description: A student investigates his motion on a roller coaster after riding two roller coasters by comparing his heartbeat on each. The student explores models of roller coaster at home with a marble and some plastic track. |
Item Descriptor |
EALR Strand, Learning Target,
and Item Characteristic
|
Item Type |
Properties of Systems
|
Structure
of Systems |
Changes in Systems
|
Inquiry
in Science |
DesigningSolutions
|
Multiple Choice |
Short Answer |
Extended Response
|
|
7
| Identify where energy is transformed from stored energy (potential) to energy of motion (kinetic) . |
ST01
1.2.2
c |
D |
8 | Identify where an object has the greatest stored energy (potential). |
ST01
1.2.2
j |
D |
9
| Determine whether an object is speeding up, slowing down, or moving with constant speed. |
PR01
1.1.2
b |
A |
10
| Recognize that the mass of an object is the same when measured anywhere at any normal speed. |
PR01
1.1.1
d |
B |
11
| Generate an interpretation based on results and support that interpretation with specific data. |
IN03
2.1.3
d |
SA |
Total |
4 |
1 | 0
| |
|
Ideal Totals
| 3-6
| 1-2
|
0-1 |
Roller Coaster
Roller Coaster
Directions: Use the following information to answer numbers 7 through 11.
Jemond’s favorite ride at the amusement park is the roller coaster. He especially likes the Coasting Thunder and Timber Coaster rides. These rides cause his heart to beat faster and harder. It takes a while for his body to get back to normal, but Jemond thinks the ride is worth it.
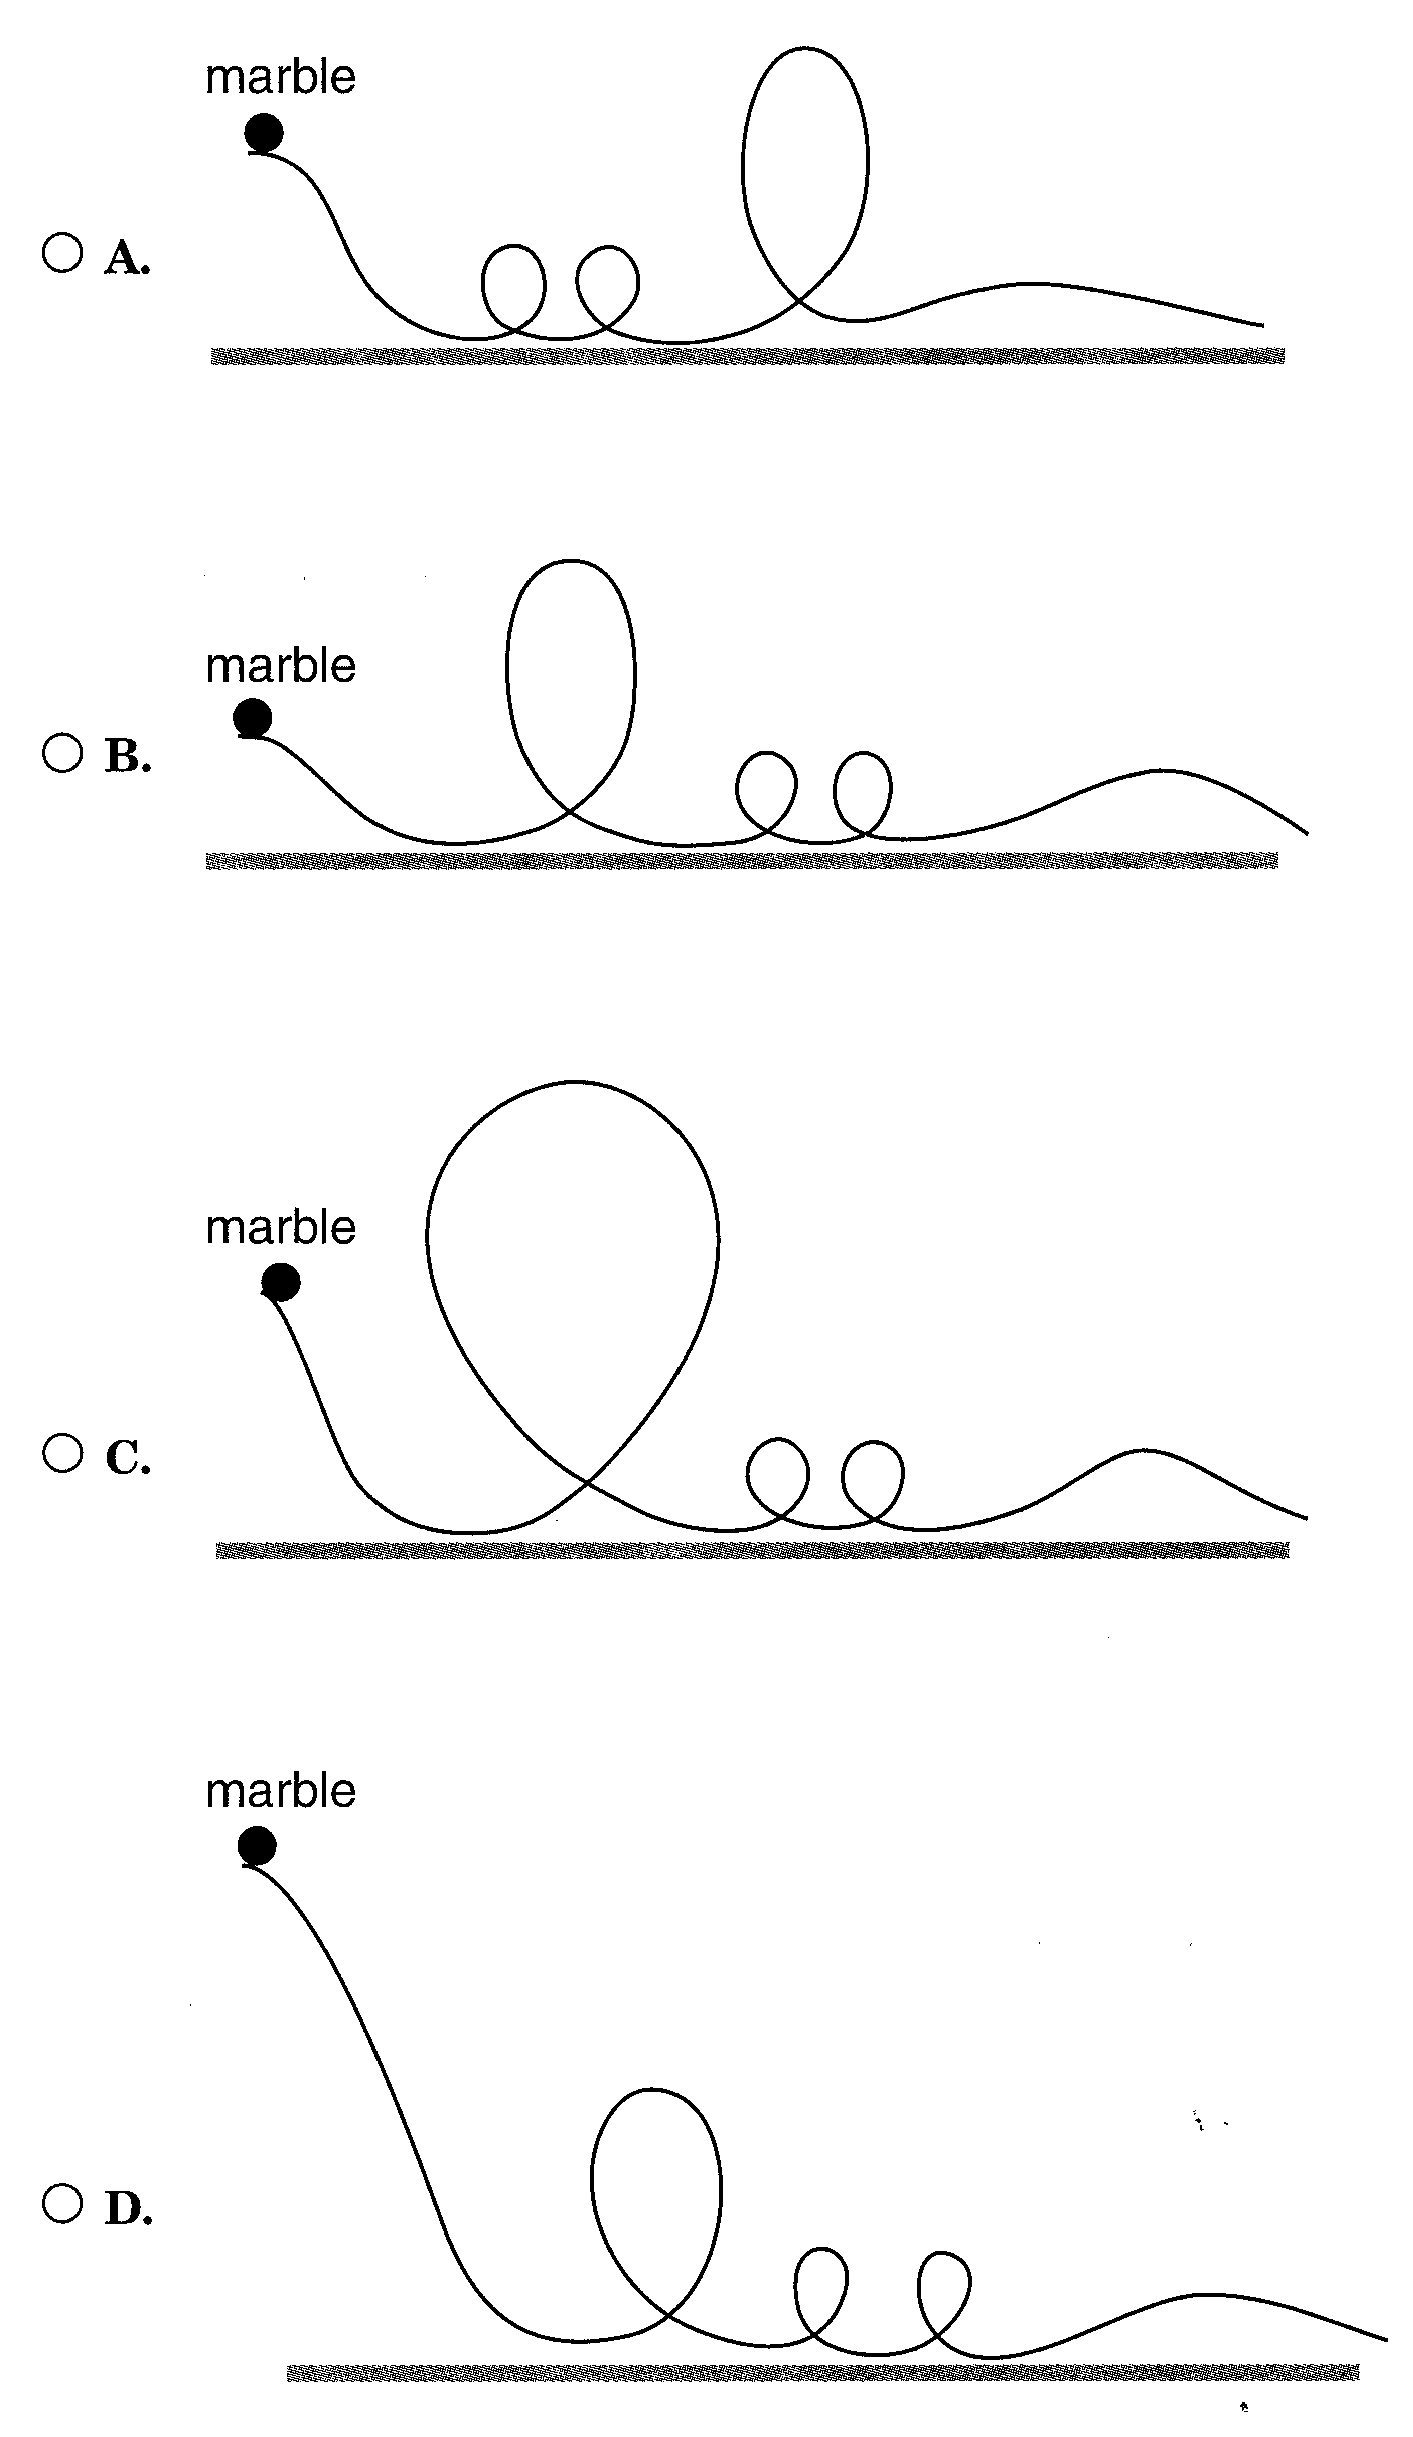
Jemond decided to make a model of a roller coaster at home. He got some plastic track, a marble, and masking tape. He made a model with one big loop and two small loops, using the plastic track. He held one end of the track in the air and placed a marble at the top of that end. He let go of the marble to see of it would go through the entire length of the track without falling out. After several trials and adjustments, Jemond was successful at getting the marble to go through the entire length without falling out.
Roller Coaster
7 Which best represents the successful model that Jemond made?
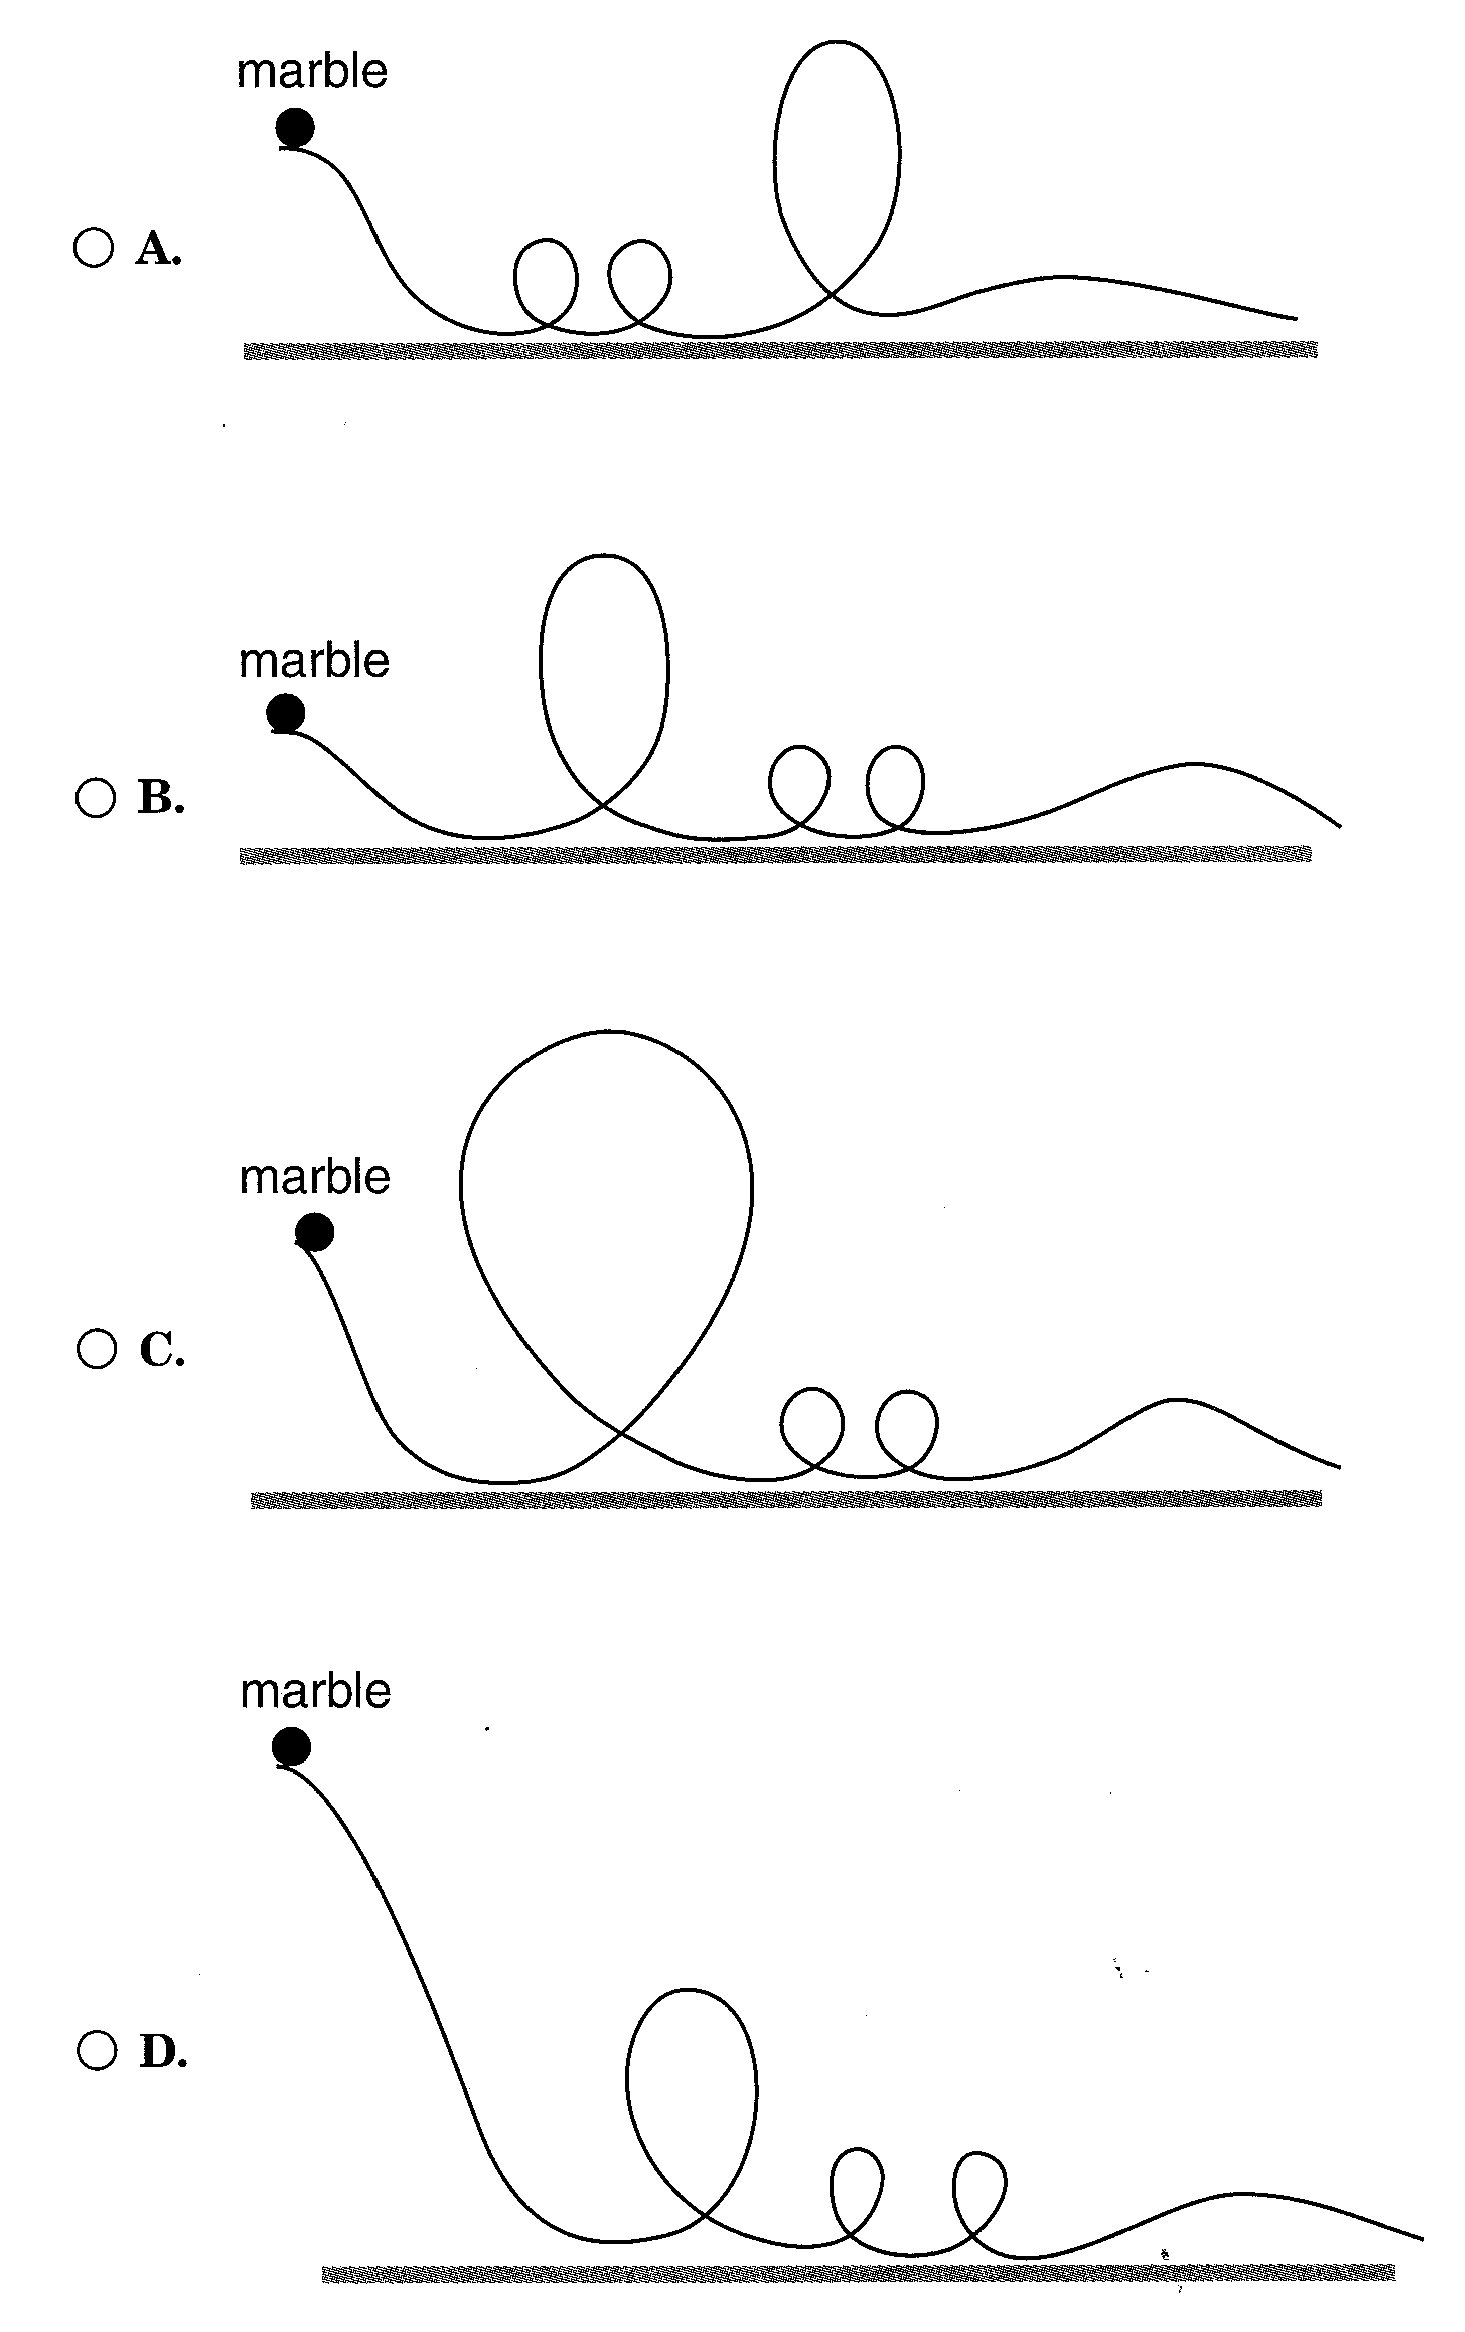
Roller Coaster
Roller Coaster
7 (continued)
Item information
Correct Response: D
EALR Strand: ST Structure of Systems
Learning Target: ST01 1.2.2 Energy Transfer and Transformation
Determine factors that affect rate and amount of energy transfer; associate a decrease in one form of energy with an increase in another.
Item Characteristic: c: Given a labeled diagram, drawing, or description of a simple system, items may ask students to identify or describe where energy is transformed from stored energy (potential) to energy of motion (kinetic) or vice versa.
Performance Data Use the space below to fill in student performance information for your school, your district, and state.
Item 7 Percent Distribution of Responses
|
Item 7
Responses
* correct response |
School |
District | State
| |
|
A | |||
B | |||
C
| |||
*D | |||
NR
(No Response) |
Roller Coaster
Roller Coaster
8 In which model does the marble have the greatest stored (potential) energy at the beginning?
Roller Coaster
Roller Coaster
8 (continued)
Item information
Correct Response: D
EALR Strand: ST Structure of Systems
Learning Target: ST01 1.2.2 Energy Transfer and Transformation
Determine factors that affect rate and amount of energy transfer; associate a decrease in one form of energy with an increase in another.
Item Characteristic: j: Given a diagram, drawing, or description of one or more objects, items may ask students identify where an object has the greatest stored energy (potential).
Performance Data Use the space below to fill in student performance information for your school, your district, and state.
Item 8 Percent Distribution of Responses
|
Item 8
Responses
* correct response |
School |
District | State
| |
|
A | |||
B | |||
C
| |||
*D | |||
NR
(No Response) |
Roller Coaster
Roller Coaster
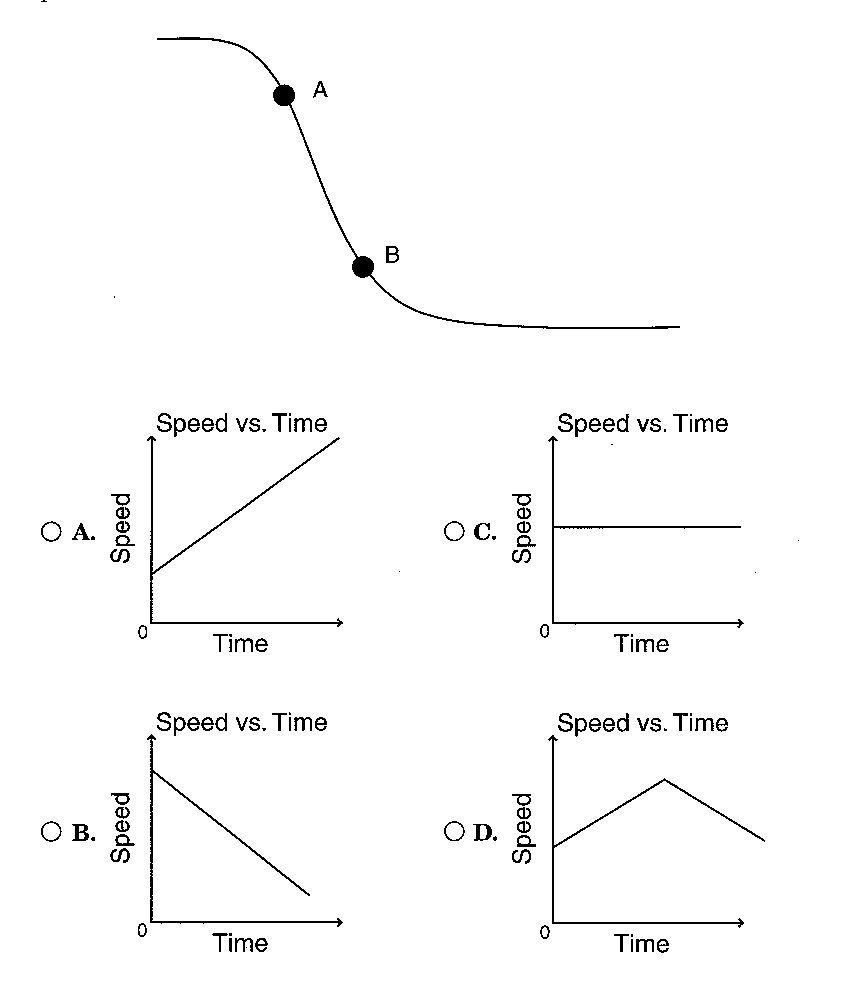
9 Which graph best represents the speed of the roller coaster from point A to point B?
![]()
Roller Coaster
Roller Coaster
9 (continued)
Item information
Correct Response: A
EALR Strand: PR Properties of Systems
Learning Target: PR01 1.1.2 Motion of Objects
Describe the positions, relative speeds, and changes in speed of objects.
Item Characteristic: b: Given a position or speed and time graph or table, items may ask students to determine whether an object is speeding up, slowing down, or moving with constant speed during a given interval of time.
Performance Data Use the space below to fill in student performance information for your school, your district, and state.
Item 9 Percent Distribution of Responses
|
Item 9
Responses
* correct response |
School |
District | State
| |
|
*A | |||
B | |||
C
| |||
D | |||
NR
(No Response) |
Roller Coaster
Roller Coaster
10 Jemond is moved around and pushed down in his seat while on the roller coaster. How is his mass affected during the ride?
- A. His mass changes based on going uphill or downhill.
- B. His mass stays the same no matter what the speed.
- C. His mass becomes less, which accounts for being moved around.
- D. His mass becomes more, which accounts for being pushed down.
Item information
Correct Response: B
EALR Strand: PR Properties of Systems
Learning Target: PR01 1.1.1 Properties of Substances
Analyze and explain the factors that affect physical and chemical changes and how matter and energy are conserved in a closed system.
Item Characteristic: d: Given a labeled picture of labeled diagram of an appropriate system, items may ask students to recognize that the mass of an object is the same when measured anywhere in the universe or at any normal speed.
Performance Data Use the space below to fill in student performance information for your school, your district, and state.
Item 10 Percent Distribution of Responses
|
Item 10
Responses
* correct response |
School |
District | State
| |
|
A | |||
*B | |||
C
| |||
D | |||
NR
(No Response) |
Roller Coaster
11 Jemond decided to compare his heart rate on each roller coaster to decide which ride was more exciting.
|
Time
(seconds) |
Heart Rate
(beats per minute) |
Coasting Thunder |
Timber Coaster | |
| before ride | 65
|
65 |
| 0 ride starts |
76 | 85
|
| 30 | 85
| 80
|
| 60 |
95 |
88 |
| 90 | 110
| 98
|
| 120 ride ends |
110 |
88 |
| 150 | 105
| 80
|
| 180 | 100
|
70 |
| 210 |
90 |
68 |
Based on this data, which ride was more exciting?
- Give one reason for your choice.
- Support your reason with data from the table
Roller Coaster
Roller Coaster
11 (continued)
Item information:
Score Points: 2
EALR Strand: IN Inquiry in Science
Learning Target: IN03 2.1.3 Explaining
Use evidence from scientific investigations to think critically and logically to develop descriptions, explanations, and predictions.
Item Characteristic: d: Given a completed investigation, items may ask students to identify or generate an interpretation based on results and support that interpretation with specific data.
Performance Data Use the space below to fill in student performance information for your school, your district, and state.
Item 11 Percent Distribution of Score Points
|
Item 11
Score Points |
School |
District | State
| |
|
0 | |||
1 | |||
2
| |||
NR
(No Response) | |||
|
Mean |
Roller Coaster
Roller Coaster
Scoring Rubric for item number 11:
A 2-point response: The student shows the ability to use evidence from scientific investigations to think critically and logically to develop explanations.
The student gives one reason for his/her choice (i.e., faster heart rate, extended high heart rate, anticipation, etc.) and uses evidence (data values from the table). The reason must make a comparison, or the data from the table must make a comparison.
Examples may include but are not limited to the following:
- One reason Coasting Thunder was more exciting is that Jemond’s heart rate became higher. His peak heart rate was 110 on Coasting Thunder compared to 98 on Timber Coaster.
- Coasting Thunder was more exciting because Jemond’s heart rate stayed higher for a longer time. For all of the measurements between 30 seconds and 210 seconds, his heart rate was higher on Coasting Thunder.
- Timber Coaster was more exciting because Jemond’s heart rate became higher in anticipation of the ride. It was 78 beats per minute on Coasting Thunder and 85 beats per minutes on Timber Coaster.
A 1-point response: The student shows some ability to use evidence from scientific investigations to think critically and logically to develop explanations.
The student gives one scientifically valid reason for his choice but does not give supporting information from the table
OR
The student gives a choice, but the scientifically valid reason does not indicate a comparison between the two rides
OR
The student presents supporting data, but choice is merely implied.
A 0-point response: The student shows little or no ability to use evidence from scientific investigations to think critically and logically to develop explanations.
The student selects a ride, but the reason is not scientifically valid
OR
The student does not indicate a choice, and provides ambiguous supporting data.
Roller Coaster
Annotated Example of a 2-point response for item number 11:
11 Jemond decided to compare his heart rate on each roller coaster to decide which ride was more exciting.
|
Time
(seconds) |
Heart Rate
(beats per minute) |
Coasting Thunder |
Timber Coaster | |
| before ride | 65
|
65 |
| 0 ride starts |
76 | 85
|
| 30 | 85
| 80
|
| 60 |
95 |
88 |
| 90 | 110
| 98
|
| 120 ride ends |
110 |
88 |
| 150 | 105
| 80
|
| 180 | 100
|
70 |
| 210 |
90 |
68 |
Based on this data, which ride was more exciting?
- Give one reason for your choice.
- Support your reason with data from the table
| The Coasting thunder was more exciting because Jemond’s |
| heartrate started out on the same number for both roller |
| coasters but on coasting thunder his heartrate went up to 100. |
| And on Timber coaster it only went up to 98. 110 is more than 98. |
Annotation:
This response demonstrates that the student shows the ability to use evidence from scientific investigations to think critically and logically to develop explanations.
The response chooses the most exciting ride and gives one reason for this choice, “on coasting thunder his heartrate went up to 100,” including data from the table (1 point). The response goes on to compare the beginning heart rates and the highest rate on Timber Coaster giving data from the table (1 point).
Roller Coaster
Annotated Example of a 1-point response for item number 11:
11 Jemond decided to compare his heart rate on each roller coaster to decide which ride was more exciting.
|
Time
(seconds) |
Heart Rate
(beats per minute) |
Coasting Thunder |
Timber Coaster | |
| before ride | 65
|
65 |
| 0 ride starts |
76 | 85
|
| 30 | 85
| 80
|
| 60 |
95 |
88 |
| 90 | 110
| 98
|
| 120 ride ends |
110 |
88 |
| 150 | 105
| 80
|
| 180 | 100
|
70 |
| 210 |
90 |
68 |
Based on this data, which ride was more exciting?
- Give one reason for your choice.
- Support your reason with data from the table
| Coasting Thunder is a more exciting ride because Jemond’s heart |
| rate is faster during the ride, and it takes longer to slow down. |
| When you get excited your heart rate goes up and his heart rate |
| suggest he was more excited when riding the Coasting Thunder |
| roller coaster |
Annotation:
This response demonstrates that the student shows some ability to use evidence from scientific investigations to think critically and logically to develop explanations.
The response chooses the most exciting ride and gives one reason for this choice including comparison to the other roller coaster (1 point). However, the response does not give any data for the table (0 points).
Roller Coaster
Roller Coaster
Annotated Example of a 0-point response for item number 11:
11 Jemond decided to compare his heart rate on each roller coaster to decide which ride was more exciting.
|
Time
(seconds) |
Heart Rate
(beats per minute) |
Coasting Thunder |
Timber Coaster | |
| before ride | 65
|
65 |
| 0 ride starts |
76 | 85
|
| 30 | 85
| 80
|
| 60 |
95 |
88 |
| 90 | 110
| 98
|
| 120 ride ends |
110 |
88 |
| 150 | 105
| 80
|
| 180 | 100
|
70 |
| 210 |
90 |
68 |
Based on this data, which ride was more exciting?
- Give one reason for your choice.
- Support your reason with data from the table
| Coasting tunder because it goes a lot faster then the other one |
Annotation:
This response demonstrates that the student shows little to no ability to use evidence from scientific investigations to think critically and logically to develop explanations.
The response chooses Coasting Thunder but gives a reason, ”it goes a lot faster then the other one” that is not the data collected nor necessarily correct (0 points). The response does not give any data from the table (0 points).
Page 55 of 59