- Directions: Use the following information to answer numbers 6 through 9.
- Directions: Use the following information to answer numbers 6 through 9.
A Component of the Washington State Assessment Program
WASL Washington Assessment
of Student Learning
A Component of the Washington State Assessment Program
Using Results to Improve
Student Learning
Science Grade 10
Released Scenarios and Items 2003

Published by the Science Assessment Team of the Washington Office of the Superintendent of Public Instruction on July 12, 2003
Copyright © 2003 by Washington Office of the Superintendent of Public Instruction (OSPI)
All rights reserved. Educational institutions within the State of Washington have permission to reproduce this document. All other individuals wishing to reproduce this document must contact OSPI.
Table of Contents
Letter from the Superintendent 2
Introduction to the Science Released Scenarios and Items 3
How to Use this Released Item Booklet and the Item Analysis Report 4
What do the Scores on the Science WASL Mean? 5
Using this Data to Improve Instruction and Student Achievement 5
Using Released Items as Professional Development Opportunities 7
The Science of Ice Cream: A physical science inquiry scenario with 5 items
Scenario Summary 8
Scenario 9
Items 1 – 4: Multiple choice items with characteristics and data 10
Item 5: Extended response item with characteristics and data 14
Scoring rubric and value point data
Annotated student responses
Plant and Animal Interdependence: A life science inquiry scenario with 4 items
Scenario Summary 34
Scenario 35
Items 6 – 7: Multiple choice items with characteristics and data 37
Item 8 & 9: Short answer items with characteristics and data 39
Scoring rubric and value point data
Annotated student responses
Ocean Water and Subducting Tectonic Plates:
Item 10: An earth science systems stand-alone item 51
Multiple choice item with characteristics and data
August 1, 2003
Dear Washington State Educators:
I am delighted to offer this third annual released test item publication from the 2003
Washington Assessment of Student Learning (WASL). My staff worked hard to be able to release this material in time for your use in administration workshops and LID day trainings for all staff. This publication is designed to assist teachers and administrators in the analysis of the results of specific test items in order to identify patterns, trends, weaknesses, and strengths of student performance on the Essential Academic Learning Requirements (EALRs).
The writing prompts and annotations from the Spring 2003 WASL will be available electronically on the OSPI website, as will released science pilot items for grade 5.
As a teacher, or as a district or building administrator, you will be able to analyze the actual test items and the data that accompany them to learn more about students in your school and district. You will be able to compare the performance of your school to your district or the state. By analyzing the differences in the data and the relationship that each question has with the EALRs, you will be able to identify areas where performance is strong and areas for improvement in your school and district. I fervently hope opportunities will be provided prior to the start of the school year for principals and teachers to work with the item-specific scoring guides in listening, reading, mathematics, and science and the annotated student responses that illustrate each score point. This experience will help schools work more effectively with students and parents this fall and throughout the school year.
OSPI hopes that you will use the information to begin a thoughtful, impassioned dialogue about what we expect our students to know and be able to do and how well they need to do it. We expect that this material will initiate conversations among administrators, faculty, students, and parents as to how this information can impact our teaching, our learning, and our communication. Plans to improve student learning should not be made based on these results alone. It is important to also include the results from other assessments used by the teacher, school, and/or district.
In November, OSPI assessment staff will again conduct regional training on the effective use of these materials.
Have a wonderful and successful school year as we continue our work toward improving student achievement in the 21st century. I encourage you to search our newly updated website, www.k12.wa.us , for further resources to guide your instructional practices.
Sincerely,
Dr. Terry Bergeson
State Superintendent of Public Instruction
Introduction to the Science Released Scenarios and Items
We are delighted to offer these released scenarios and items from the first operational science WASL given in the spring of 2003. This release booklet contains two scenarios with associated items and one stand-alone item: about 25% of the exam. Release booklets are designed to assist teachers and administrators in understanding how the science WASL measures students’ achievement of the science EALRs.
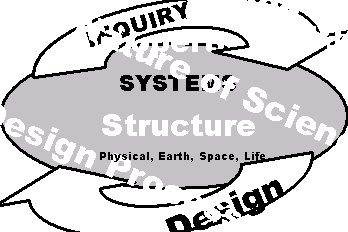
The science WASL is composed of scenarios modeling the three themes of the science EALRs: systems (including properties, structure and changes), inquiry, and design as shown below in our science EALR graphic. Students’ scores are reported in five strands: properties of systems, structure of systems, changes in systems, inquiry in science, and designing solutions.
 Systems scenarios describe a familiar system including some inputs, outputs,
and transfers of matter, energy, and/or information. Students are asked to
demonstrate their understanding of the system and what might happen as part of
the system changes. About forty percent of the exam involves measuring systems
learning targets.
Systems scenarios describe a familiar system including some inputs, outputs,
and transfers of matter, energy, and/or information. Students are asked to
demonstrate their understanding of the system and what might happen as part of
the system changes. About forty percent of the exam involves measuring systems
learning targets.
Inquiry scenarios describe a scientific investigation. Students are asked about the attributes of the investigation, asked to write conclusions, to make predictions, and how to deal with nature of science issues such as inconsistencies. Often students are asked to plan a new investigation similar to the scenario’s
investigation. About forty percent of the exam involves measuring inquiry learning targets. Both of the scenarios in this year’s release are descriptions of an investigation.
Design scenarios describe how a solution to a human problem or challenge was designed. Students are asked about the system being ‘fixed’ or manipulated and the use of scientific concepts and/or data in the solution. Often students are asked to describe how a solution could be designed for a new problem or challenge similar to the one described in the scenario. About twenty percent of the exam involves measuring design learning targets
In addition to this booklet, there are many other instructionally supportive materials available for the science WASL including these released scenarios made into mini-science WASLs. To access these resources, please go to the OSPI website ( www.k12.wa.us ) and click to the science assessment webpage.
If you have any questions or ideas, please contact Roy Q. Beven at rbeven@ospi.wednet.edu.
Sincerely,
![]()
Roy Q. Beven, OSPI Science Assessment Specialist
How to Use this Released Item Booklet
and the Item Analysis Report
Introduction:
You should have two documents: this Released Item Booklet and the Item Analysis Report. These two documents should be used together to help administrators and teachers understand and use released science WASL scenarios and items to assess and improve student achievement of the specific learning strands and targets (benchmark indicators) of the Science EALRs.
This Released Item Booklet includes the following information:
- WASL science scenarios and items from the 2003 operational exam
- A table for each item where you can enter the school-level, district-level, and state-level data information for that item
- Information to indicate the strand, learning target, and item characteristic for each item
- Item-specific scoring rubrics, sample student responses at each score point, and annotations for each student response explaining how the score was derived
The Item Analysis Report includes the following information:
- A list of all released items referenced to strands and learning targets
- Data on student responses to multiple-choice items including the percentage of students who responded to each possible answer by school, district, and state. Correct answers have asterisks.
- Data for constructed-response items (short answer and extended response) is presented by the percentage of students who scored at each score point by school, district, and state.
-
 Data for the “planning an investigation” extended response (4-point)
item is presented in terms of up to ten value points by school, district, and
state. The attributes of a scientific investigation are assigned value points
that are used to derive the student’s item score.
Data for the “planning an investigation” extended response (4-point)
item is presented in terms of up to ten value points by school, district, and
state. The attributes of a scientific investigation are assigned value points
that are used to derive the student’s item score.
To Interpret Your Data:
- First, transfer your data from the Item Analysis Report to the Released Item Booklet. Transfer all the information for each item into each table so that you will have all the information in one place.
- Second, examine the item types to determine the strengths and weaknesses in student performance in your school or district. Do the students perform well on multiple-choice items? Constructed-response items? What percentage of students in a school or district left constructed-response items blank or earned a zero?
- Third, examine the data by strand and learning targets. Group together targets that represent strengths and weaknesses for the students in a school or a district. Do the targets all fit under one particular strand or do they belong to several strands?
-
Fourth, look for trends. Do the students in your school perform markedly lower
or markedly higher on a particular item in comparison to the students in the
district or the state?
What do the Scores on the Science WASL Mean?
Like all the high school WASLs, the 10 th grade science WASL measures what all students should know and be able to do in science by the spring of their 10 th grade year, or before graduating from high school. The science WASL does not measure student understanding developed in one course or one school year. The science WASL measures students’ understanding of science concepts and processes developed from Kindergarten through 10th grade.
The items on the science WASL measure the learning targets (benchmark indicators) of the science EALRs. These learning targets are organized into the five reported strands: three systems strands, an inquiry strand, and a design strand. Thus the strand scores indicate how well students understand the learning targets of that strand.
Using this Data to Improve Instruction and Student Achievement
To add meaning to the strand scores, science educators should establish where their classrooms and school systems provide students the opportunity to build understanding of the science learning targets associated with each strand. To improve student learning, determine how to refine the instructional activities that are intended to build understanding of the learning targets of each strand.
Teachers:
If you teach a specific 9th or 10th grade course, look at your school results in the reported strands. Then look at the strand’s learning targets pertinent to your course. Consider the instructional activities your students have experienced in your course and in their K-8 or K-9 experience. Ask yourself, “How could I improve my students’ learning of those targets?”
For example: Suppose you teach a 9 th grade science course focused on physical science and your school’s student scores are low in the Inquiry in Science strand (the green pages of the color-coded science EALRs available on the science assessment webpage).
- Study the ‘Science of Ice Cream’ scenario in this booklet and compare the inquiry items to the ten learning targets in the Inquiry in Science strand of the science EALRs.
- In the ‘General Characteristics of the Science WASL’ or the ‘ Test and Item Specifications of the Science WASL,’ you will find a page that describes the 16 questions generally asked about science inquiry. Consider how your course helps students show their understanding of inquiry in science as measured by these questions.
-
Talk with the teachers of science in grade K through 10. Find out how the
Inquiry in Science
learning targets are being developed in earlier grades. Then plan how you can
build on what students have experienced and learned.
Using this Data to Improve Instruction and Student Achievement (continued)
Teachers: (continued)
For example: Suppose you teach a 10 th grade science course focused on life science (i.e. Biology) and your school’s student scores are low in the Changes in Systems strand (the yellow pages of the color-coded science EALRs available on the science assessment webpage).
- Study the ‘Plant and Animal Interdependence’ scenario in this booklet and compare the systems items to the three life science learning targets in the Changes in Systems strand. Consider how your course helps students understand how organisms and ecosystems can sustain life, the concepts of speciation, adaptation, and biological diversity, and the complex biotic and abiotic factors that affect ecosystems. Perhaps your course can provide more opportunity to learning these concepts.
- In the ‘General Characteristics of the Science WASL,’ or the ‘ Test and Item Specifications of the Science WASL,’ you will find a page that describes the 17 questions generally asked about systems. Consider how your course helps students show their understanding of living systems in science as measured by these questions.
- Talk with the teachers of science in grade K through 10. Find out how the Changes in Systems life science learning targets are being developed in earlier grades. Then build on what students have experienced and learned.
- Learn how to make your written assessments WASL-like (scenario-based, EALR-focused exams) by attending science assessment workshops offered by your school, district, ESD, or OSPI in conjunction with the Science Assessment Leadership Team.
Schools and District Administrators:
As science teachers improve their 1-year or 1-semester courses, the high school should assure that in 9th and 10th grades, students have the opportunity to learn the science systems, inquiry and design high school learning targets (EALR benchmark indicators).
For example: In the Changes in Systems strand there are three physical science and four Earth/space science learning targets. If the three life science learning targets are well developed in one grade or course, where do students have the opportunity to learn the seven other learning targets of that strand? Perhaps courses focused upon a particular science (i.e. Biology) can provide students the opportunity to build understanding of learning targets in the other sciences as well.
As a high school refines the science experience for all students, school districts need to assure students entering high school have had the opportunity to learn the elementary and middle school science systems, inquiry, and design learning targets. A student cannot learn all about science in high school.
Using Released Items as Professional Development Opportunities
Key Goals of Professional Development Opportunities
Key Goals of Professional Development Opportunities
- Develop understanding of the themes of the science EALRs
- Develop understanding of the science WASL, the data it provides, and the relationship between the WASL data and classroom instruction
- Develop a deeper understanding of how to objectively score student responses in science
Half-Day Professional Development
- Use this release booklet and follow guidelines for “How to Use this Released Item Booklet and Item Analysis Report”. Depending on configuration of the participating group, complete data for grades 8 and 10 or just do grade specific data.
- Provide data analysis from the 2003 released items and ask, “Where do we see areas that need further improvement?” and “What instructional practices can improve student learning in those areas?” Formulate questions based on the work you have done in the school and/or district.
- Compare science WASL assessment results with other school and/or district assessments to further define areas in which to focus instruction.
- Contact your district or region’s science assessment leaders and ask them to use the General Characteristics of the Science and accompanying PowerPoint presentation to facilitate understanding and discussion of the science EALRs and WASL.
Full-Day Professional Development
- Complete the suggestions for Half-Day Professional Development
- Contact your district’s or region’s science assessment leaders to receive more in depth training on the Scoring Student Responses on the Science WASL packets that contain instructions and a full set of anchor and practice papers with annotations for the released items.
Follow-Up Professional Development Involving Students
- Have teachers build scenarios with items as end-of-unit assessments using the Planning WASL-like Assessments in Science (available in 2004) and share the assessments with their peers before using them.
- Use WASL-like scenarios to assess students at the end of an instructional unit then teach the students how to score their own responses.
-
Bring teachers together with their student’s assessments and ask, “
What do the results tell us?” Lay out the unit of study and ask, “How
can we modify this unit to build appropriate understanding of the targeted
science learning targets?”
2003 Released Science Scenario with Items
The Science of Ice Cream Summary
| Title: The Science of Ice Cream | Grade: 10 |
| Description: Students investigate how the amount of salt affects the freezing temperature of water and how this effect is applied in the making of ice cream. The student is then asked to plan a new investigation about the effect of fat content of milk to the time required to make ice cream. |
Item Descriptor |
EALR Strand, Learning Target,
and Item Characteristic
|
Item Type |
Properties of Systems
|
Structure
of Systems |
Changes in Systems
|
Inquiry
in Science |
DesigningSolutions
|
Multiple Choice |
Short Answer |
Extended Response
|
|
1
| Propose a design change to solve the problem of the ice cream freezing too quickly. |
DE03
3.1.3
c |
B |
2 | Identify that salt is added to crushed ice to affect melting temperature. |
CH01
1.3.3
d |
C |
3
| Identify that the salt-ice-water solution will become saturated so added salt has no effect. | CH01
1.3.3
d |
A |
4
| Identify that continually added salt will eventually stop dissolving. |
CH01
1.3.3
d |
C |
5
| Plan a new complex scientific investigation based upon the investigation described in the scenario |
IN02
2.1.2
b |
ER |
Total |
4 | 0
| 1
|
Ideal Totals |
3-6 | 1-2
| 0-1
|
The Science of Ice Cream
The Science of Ice Cream
Directions: Use the following information to answer numbers 1 through 5.
Jacob and Tonya wanted to make homemade ice cream using an electric ice cream maker.
They made their ice cream mix with the following ingredients:
- milk and cream (contains milk fats, milk solids, and water)
- sweetener
- flavoring
The ice cream maker has an outer bucket to hold the ice and salt. The ice cream maker also has a removable inner metal freezing container where Jacob and Tonya placed the ice cream mix. They place the mixer into the inner container after they added the mix. Then they added 500 g of salt (sodium chloride) and 5 kg of crushed ice evenly to the outer bucket surrounding the inner container. As the electric motor turned the mixer, some of the ice in the outer bucket melted.

Jacob and Tonya wanted to determine whether changing the amount of salt added to the crushed ice would have an effect on the freezing point. The data table below shows their findings as they added salt and measured the water’s freezing temperature with a thermometer.
Freezing Temperature of
Water (5 liters) with Added Salt
Added Salt
(g) |
Freezing
Temperature
(C°) |
0 |
0.0 |
102 |
-1.4 |
263 |
-3.5 |
556 |
-7.4 |
882 |
-11.7 |
1,250 |
-16.6 |
1,494 |
-20.0 |
The Science of Ice Cream
The Science of Ice Cream
1 On their first attempt, Jacob and Tonya found that their ice cream was coarse and icy. After reading more about ice cream making, they concluded the ice cream mix had become too cold, too quickly. Which of the following design changes could solve their problem?
- A. Increase the amount of ice in the bucket
- B. Decrease the amount of salt added to the ice
- C. Increase the time the mixture sits in the metal container
- D. Decrease the speed of the mixer inside the metal container
Item information
Correct Response: B
EALR Strand: DE Designing Solutions
Learning Target: DE03 3.1.3 Evaluating Potential Solutions
Propose, revise, and evaluate the possible constraints, applications, and consequences of solutions to a problem or challenge
Item Characteristic: c: Given a problem, attempted solution, unsuccessful or partially successful results, and criteria for evaluation, items may ask students to use scientific concepts or processes to modify the design or product to improve its effectiveness.
Performance Data Use the space below to fill in student performance information for your school, your district, and state.
Item 1 Percent Distribution of Responses
|
Item 1
Responses
* correct response |
School |
District | State
| |
|
A | |||
*B | |||
C
| |||
D | |||
NR
(No Response) |
The Science of Ice Cream
2 Why did Jacob and Tonya add salt to the crushed ice?
- A. Salt decreases the density of the ice.
- B. Salt causes the crushed ice to vaporize.
- C. Salt lowers the temperature at which the ice will melt.
- D. Salt diffuses into the ice cream to lower the temperature.
Item Information
Correct Response: C
EALR Strand: CH Changes in Systems
Learning Target: CH01 1.3.3 Physical and Chemical Changes
Analyze and explain the factors that affect physical and chemical changes and how matter and energy are conserved in a closed system.
Item Characteristic: d: Given an adequate description and/or a labeled picture/diagram of an appropriate system, items may ask students to describe the effects of different factors (atmospheric pressure, temperature, nuclear stability) on physical change, chemical change, or nuclear change.
Performance Data Use the space below to fill in student performance information for your school, your district, and state.
Item 2 Percent Distribution of Responses
|
Item 2
Responses
* correct response |
School |
District | State
| |
|
A | |||
B | |||
*C
| |||
D | |||
NR
(No Response) |
The Science of Ice Cream
The Science of Ice Cream
3 Look at the trend in the data table in the scenario on page 9. Tonya and Jacob added 1600 g of salt, and noticed that the freezing point did not drop farther. What would cause the downward trend to end?
- A. The solution becomes saturated, so the extra salt has no effect.
- B. Dissolved salt releases energy, keeping the temperature constant.
- C. The solution’s temperature and room temperature reached equilibrium.
- D. Heat energy released by the metal container causes the solution to crystallize.
Item information
Correct Response: A
EALR Strand: CH Changes in Systems
Learning Target: CH01 1.3.3 Physical and Chemical Changes
Analyze and explain the factors that affect physical and chemical changes and how matter and energy are conserved in a closed system.
Item Characteristic: d: Given an adequate description and/or a labeled picture/diagram of an appropriate system, items may ask students to describe the effects of different factors (atmospheric pressure, temperature, nuclear stability) on physical change, chemical change, or nuclear change.
Performance Data Use the space below to fill in student performance information for your school, your district, and state.
Item 3 Percent Distribution of Responses
|
Item 3
Responses
* correct response |
School |
District | State
| |
|
*A | |||
B | |||
C
| |||
D | |||
NR
(No Response) |
The Science of Ice Cream
4 What would happen if they continually added salt to the ice and water in the outer bucket?
- A. The salt crystals would freeze.
- B. The freezing point would reach absolute zero.
- C. The added salt would eventually stop dissolving.
- D. The sodium ions would break down the water molecules.
Item information
Correct Response: C
EALR Strand: CH Changes in Systems
Learning Target: CH01 1.3.3 Physical and Chemical Changes
Analyze and explain the factors that affect physical and chemical changes and how matter and energy are conserved in a closed system.
Item Characteristic: d: Given an adequate description and/or a labeled picture/diagram of an appropriate system, items may ask students to describe the effects of different factors (atmospheric pressure, temperature, nuclear stability) on physical change, chemical change, or nuclear change.
Performance Data Use the space below to fill in student performance information for your school, your district, and state.
Item 4 Percent Distribution of Responses
|
Item 4
Responses
* correct response |
School |
District | State
| |
|
A | |||
B | |||
*C
| |||
D | |||
NR
(No Response) |
The Science of Ice Cream
- Tonya and Jacob read that premium ice creams contain a higher content of milk fat. They planned an investigation to see if making ice cream from various types of milk requires more time. Using the following materials, plan their investigation.
Materials:
electric ice cream maker
ice
salt
3 types of milk; nonfat, 1% fat, and 2% fat
cream
sweetener
flavoring
thermometer
Be sure to include:
- Investigative question
- Hypothesis
- Procedure that includes:
- logical steps to perform the investigation
- two controlled variables (kept the same)
- one manipulated variable (changed)
- one responding variable (dependent)
- an experimental control
- how often measurements are taken and recorded
Use words, labeled pictures, and/or labeled diagrams in your response.
| Question: |
| Hypothesis: |
The Science of Ice Cream
5 (continued)
You may use the space below for a labeled diagram to support your procedure.
| Procedure: |
The Science of Ice Cream
5 (continued)
Item information
Score points: 4
EALR Strand: IN Inquiry in Science
Learning Target: IN02 2.1.2 Planning and Conducting Investigations
Plan, conduct, and evaluate systematic and complex scientific investigations, using appropriate technology, multiple measures, and safe approaches.
Item Characteristic: b: Given a description of a scientific investigation and investigation results, items may ask students to plan a second investigation for a different investigative question that can be answered using a similar plan.
Performance Data Use the space below to fill in student performance information for your school, your district, and state.
Item 5 Percent Distribution of Score Points
|
Item 5
Score Points |
School |
District | State
| |
|
0 | |||
1 | |||
2
| |||
3 | |||
4
| |||
NR
(No Response) | |||
|
Mean |
The Science of Ice Cream
Scoring Rubric for Item 5
A 4-point response: The student shows the ability to plan a complex scientific investigation. The student plans an investigation that earns 8-11 value points.
Question: 1 value point for a scientific question such as “What is the effect of the milk’s fat content on the time needed for the milk to become ice cream?” The question must include both the manipulated and responding variable.
Hypothesis: 1 value point for a prediction that relates to the student’s question and 1 value point for a cause-effect reason for the prediction such as “If milk has a higher fat content, it will take longer to become ice cream because fat is slower to freeze.” The prediction portion of the hypothesis must be specific. For example, “The change will have an effect” is not a prediction. However, the null hypothesis, “The change will have no effect” is acceptable. Stating the cause-effect relationship as “having a higher fat content” does not suffice unless it is connected to the responding variable (time to freeze).
Procedure: (up to 8 value points, 1 value point per bulleted feature)
Expected:
- At least two controlled variables are identified or implied such as ice-salt solution and amount of ingredients. If the investigation says, “Repeat the steps”, then the mixer will be credited as being one controlled variable. “Make the ice cream in the same way” will qualify as two controlled variables. “Mix the ice cream” does not qualify.
- The type of milk or fat content of the milk is identified or implied as the manipulated variable.
- The time to become ice cream is identified or implied as the responding (dependent) variable.
- Repeated trials (more one than) are planned to measure the responding variable.
- Measurements are recorded in periodically throughout the investigation.
- The steps of the investigation are logical with enough detail to repeat the procedure effectively. If the student uses 3 mixers, that is not logical because there is only 1 in the materials. If the student indicates a vague “mix until the ice cream is done, that is okay for this item because the scenario is vague with the specifics of when ice cream is done.
Not necessarily expected but always credited:
- An experimental control is clearly identified, such as stating, “ice cream made from nonfat milk is used for comparison.”
- Validity measures are identified or implied such as thoroughly cleaning the icemaker between trials.
Note: If the student plans an investigation to answer a different question than the one implied, he/she will lose the value point for question, but may earn the other value points based on the new investigation.
The Science of Ice Cream
Scoring Rubric for Item 5 (continued)
A 3-point response: The student shows the ability to plan a scientific investigation. The student plans an investigation that earns 6-7 value points.
A 2-point response: The student shows some ability to plan a scientific investigation. The student plans an investigation that earns 4-5 value points.
A 1-point response: The student shows the limited ability to plan a scientific investigation. The student plans an investigation that earns 2-3 value points.
A 0-point response: The student shows almost no ability to plan a scientific investigation. The student plans an investigation that earns 0-1 value points.
Performance Data Use the space below to fill in student performance information for your school, your district, and state.
Item 5 Percent Distribution of Value Points |
Item 5 Value Point Investigation Attributes |
School |
District | State
| |
|
Question | |||
Prediction | |||
Prediction Reason | |||
Controlled Variable | |||
Manipulated Variable | |||
Responding Variable | |||
Repeated Trials | |||
Experimental Control | |||
Record Measurements | |||
Validity Measures | |||
Logical Steps |
The Science of Ice Cream
An annotated Example of a 4-point response for item 5:
5 Tonya and Jacob read that premium ice creams contain a higher content of milk fat. They planned an investigation to see if making ice cream from various types of milk requires more time. Using the following materials, plan their investigation.
Materials:
electric ice cream maker
ice
salt
3 types of milk: non-fat, 1% fat, and 2% fat
cream
sweetener
flavoring
thermometer
Be sure to include:
- Investigative question
- Hypothesis
- Procedure that includes:
- logical steps to perform the investigation
- two controlled variables (kept the same)
- one manipulated variable (changed)
- one responding variable (dependent)
- an experimental control
- how often measurements are taken and recorded
Use words, labeled pictures, and/or labeled diagrams in your response.
| Question: Does change the type of milk effect the amount of time it |
| takes to make ice cream? |
| Hypothesis: I believe that the extra fat in the milk will make the |
| procedure take longer. The added fat will make it longer for the |
| temperature to lower. |
The Science of Ice Cream
An annotated Example of a 4-point response for item 5: (continued)
You may use the space below for a labeled diagram to support your procedure.
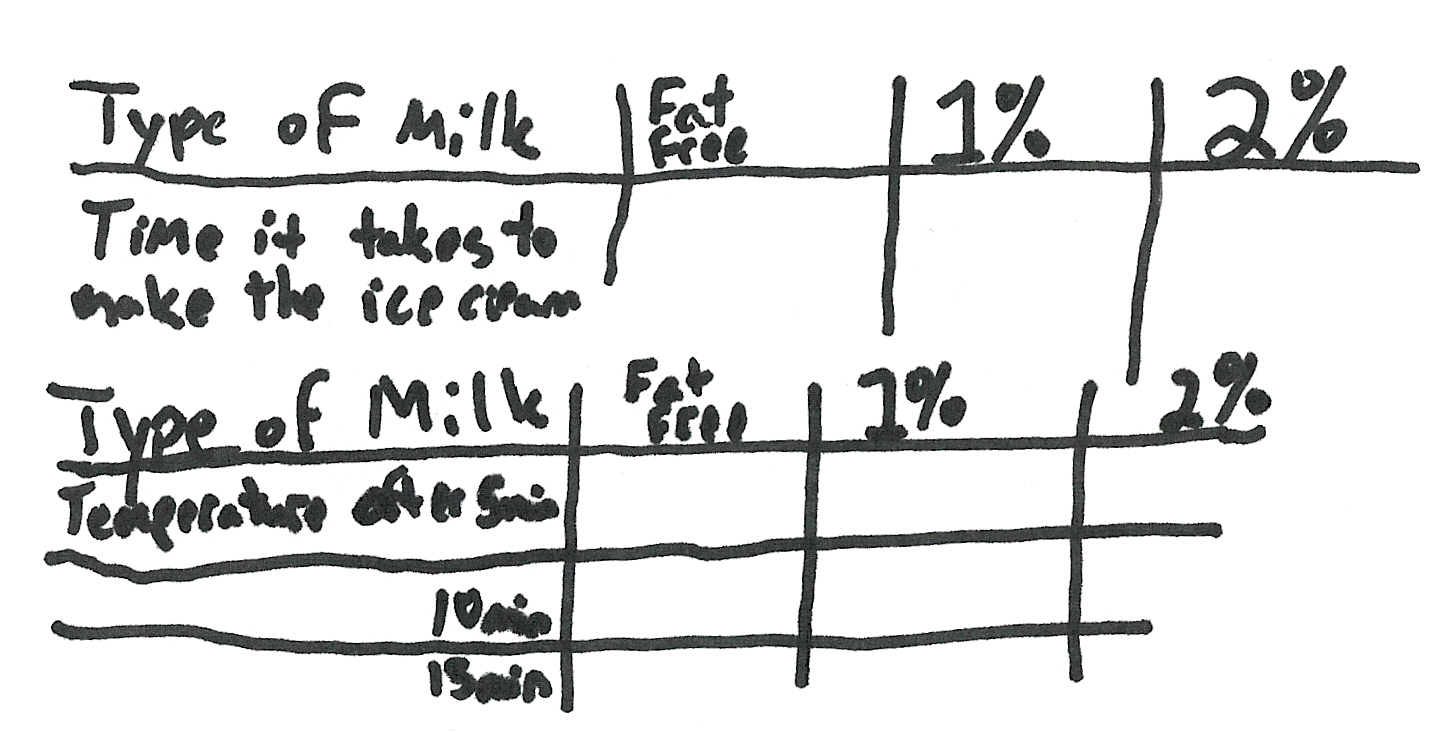 |
| Procedure: Make three different batches of ice cream but change |
| only one variable: the type of milk. Fat Free, one percent, and two |
| percent will be tested. Use 500 g of salt and 5kg of crushed ice. |
| Do not change the amount of milk, cream, sweetener, or flavoring. |
| First make the ice cream with Fat Free, recording the temperature |
| every 5 minutes until the ice cream is done. Record the amount of |
| time it took the ice cream to finish. Then repeat with the other |
| two milks. Check for changes for the time it took to finish and how |
| big of temperature changes occurred. If the 2% takes longer to |
| cool down and finish than Fat Free the 1%in the middle then my |
| hypothesis is correct. |
The Science of Ice Cream
An annotation for the sample 4-point response for item 5:
This response demonstrates that the student shows the ability to plan a complex scientific investigation. The response was awarded 8 value points for 4 score points.
- The investigative question includes both the manipulated variable and the responding variable (1 point).
- The hypothesis predicts that “extra fat in the milk will make the procedure take longer” (1 point) and states that the reason for the prediction is “ the added fat will it take longer for the temperature to lower ” (1 point).
- Two or more controlled variables are listed: 500 g of salt, 5 kg of ice, and same amount of ingredients (1 point).
- Only one variable is manipulated, “ …change only one variable: the type of milk ” (1 point).
- The responding variable is implied, “Record the amount of time it took for the ice cream to finish” (1 point).
- Measurements are recorded (1 point).
- The steps of the investigation are logical with enough detail to repeat the procedure effectively (1 point).
-
No repeated trails, experimental control, nor any validity measures were stated
(no points).
The Science of Ice Cream
An annotated Example of a 3-point response for item 5:
5 Tonya and Jacob read that premium ice creams contain a higher content of milk fat. They planned an investigation to see if making ice cream from various types of milk requires more time. Using the following materials, plan their investigation.
Materials:
electric ice cream maker
ice
salt
3 types of milk: non-fat, 1% fat, and 2% fat
cream
sweetener
flavoring
thermometer
Be sure to include:
- Investigative question
- Hypothesis
- Procedure that includes:
- logical steps to perform the investigation
- two controlled variables (kept the same)
- one manipulated variable (changed)
- one responding variable (dependent)
- an experimental control
- how often measurements are taken and recorded
Use words, labeled pictures, and/or labeled diagrams in your response.
| Question: Does changing the type of milk used to make ice cream |
| make the ice cream form more slowly |
| Hypothesis: The higher fat content the milk contains the longer it |
| takes to make the icecream. |
The Science of Ice Cream
Annotated Example of a 3-point response for item number 5 (continued):
You may use the space below for a labeled diagram to support your procedure.
 |
| Procedure: First make icecream using milk and cream by mixing the |
| sweetner flavoring and milk and cream and time how long it takes |
| to be made when made with an electric icecream maker. This will |
| be the control. The amount of flavoring, sweetener and the |
| ice/salt and machine will be kept the same. These are the |
| controlled variables. Repeat the experiment 3 more times but |
| substitute the milk and cream for nonfat the first time 1% the |
| second and 2% fat the third and measure the length of time |
| needed for the icecream to be made. Take measurements every 5 |
| min. |
The Science of Ice Cream
An annotation for the sample 3-point response for item 5:
This response demonstrates that the student shows the ability to plan a scientific investigation. The response was awarded 7 value points for 3 score points.
- The investigative question includes both the manipulated variable and the responding variable (1 point).
- The hypothesis predicts that “The higher fat content the milk contains the longer it takes” (1 point) but does not state a reason for the prediction (no point).
- Two or more controlled variables are listed: “ The amount of flavoring, sweetener and the ice/salt and machine will be kept the same.” (1 point).
- The manipulated variable is implied as the type of milk (1 point).
- The responding variable is implied, “measure the length of time needed for the icecream to be made” (1 point).
- Measurements are not recorded; “ Take measurements ” cannot be credited (0 point).
- The steps of the investigation are logical with enough detail to repeat the procedure effectively (1 point).
- The experimental control is identified as the first batch of ice cream made by stating, “ This will be the control” (1 point).
- No repeated trails, experimental control, nor any validity measures were stated (no points).
The Science of Ice Cream
Annotated Example of a 2-point response for item number 5:
5 Tonya and Jacob read that premium ice creams contain a higher content of milk fat. They planned an investigation to see if making ice cream from various types of milk requires more time. Using the following materials, plan their investigation.
Materials:
electric ice cream maker
ice
salt
3 types of milk; nonfat, 1% fat, and 2% fat
cream
sweetener
flavoring
thermometer
Be sure to include:
- Investigative question
- Hypothesis
- Procedure that includes:
- logical steps to perform the investigation
- two controlled variables (kept the same)
- one manipulated variable (changed)
- one responding variable (dependent)
- an experimental control
- how often measurements are taken and recorded
Use words, labeled pictures, and/or labeled diagrams in your response.
| Question: Does making the ice cream from various types of milk |
| require more time? |
| Hypothesis: I don’t think it will make more time using different milks. |
The Science of Ice Cream
Annotated Example of a 2-point response for item number 5 (continued):
You may use the space below for a labeled diagram to support your procedure.
| Procedure: First I would set the equipment up. Then I would make |
| ice cream using the nonfat milk and record how long it took to |
| make. Second I would make ice cream using the 1% milk and |
| record how long it took. Third I would make ice cream using the |
| 2% milk and record how long it took. At the end I would compare |
| the results and see if one took more time and then the others. |
The Science of Ice Cream
An annotation for the sample 2-point response for item 5:
This response demonstrates that the student shows some ability to plan a complex scientific investigation. The response was awarded 5 value points for 2 score points.
- The investigative question includes both the manipulated variable and the responding variable (1 point).
- A null hypothesis is given stating, “I don’t think it will make more time using different milks.” (1 point because “ it ” can be assumed to mean the making of ice cream so this hypothesis states both the manipulate variable, “ different milks,” and the responding variable, “ time”). However, no reason is given for this prediction (0 point).
- Only one controlled variable is implied, the ice cream maker (0 point).
- The manipulated variable is implied as the type of milk (1 point).
- The responding variable is implied, “record how long it took” (1 point because “ it ” can be assumed the making of ice cream).
- Measurements are recorded (1 point).
- The steps of the investigation are not logical enough to repeat the procedure effectively; simply stating, “ make ice cream” is too vague to repeat (0 point).
- No repeated trails, experimental control, nor any validity measures were stated (no points).
The Science of Ice Cream
Annotated Example of a 1-point response for item number 5:
5 Tonya and Jacob read that premium ice creams contain a higher content of milk fat. They planned an investigation to see if making ice cream from various types of milk requires more time. Using the following materials, plan their investigation.
Materials:
electric ice cream maker
ice
salt
3 types of milk; nonfat, 1% fat, and 2% fat
cream
sweetener
flavoring
thermometer
Be sure to include:
- Investigative question
- Hypothesis
- Procedure that includes:
- logical steps to perform the investigation
- two controlled variables (kept the same)
- one manipulated variable (changed)
- one responding variable (dependent)
- an experimental control
- how often measurements are taken and recorded
Use words, labeled pictures, and/or labeled diagrams in your response.
| Question: Will the various types of ice cream take a longer amount |
| of time to produce the ice cream? |
| Hypothesis: I believe that since premium ice cream contains more milk |
| fat, the non-fat milk will take the longest, then 1%, and finally, |
| the 2% |
The Science of Ice Cream
Annotated Example of a 1-point response for item number 5 (continued):
You may use the space below for a labeled diagram to support your procedure.
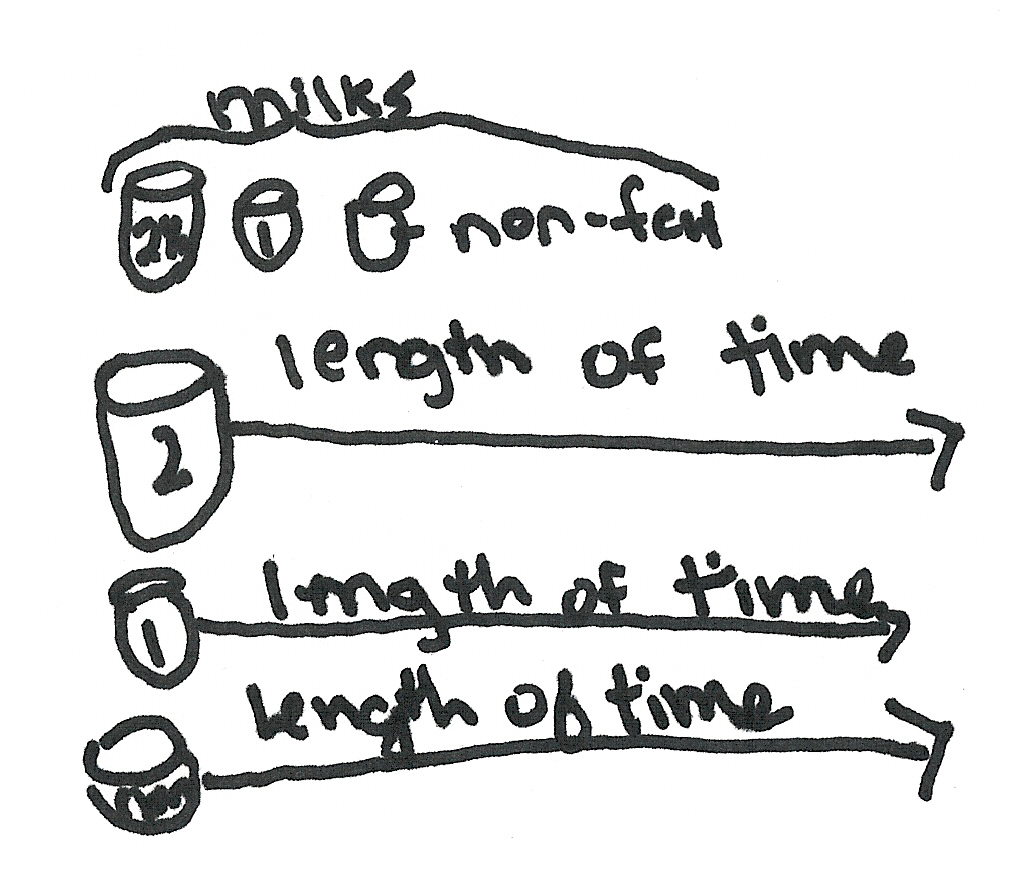
 |
| Procedure: Put the ice and salt in the outer bucket, as usual. Mix |
| the non-fat milk with cream, sweetener and flavoring. Put this in |
| the inner bucket. Mix as usual. Be sure you time how long it |
| takes to make the ice cream. Repeat these steps using the 1% |
| milk and the 2% milk. |
The Science of Ice Cream
An annotation for the sample 1-point response for item 5:
This response demonstrates that the student shows little ability to plan a complex scientific investigation. The response was awarded 3 value points for 1 score point.
- The investigative question confuses types of milk with types of ice cream (0 point).
- The hypothesis states a prediction, ”the non-fat milk will take the longest” (1 point), but does not include a reason for this prediction (no point). The phrase, ”since premium ice cream contains more milk fat” cannot be credited. A reason must be about the cause-effect relationship between milk fat and freezing time, the manipulated and responding variable.
- No controlled variables are implied because stating, ”Mix as usual” is too vague to credit (0 point).
- The manipulated variable is implied as the type of milk (1 point).
- The responding variable is implied, “Be sure you time how long it takes” (1 point because “ it ” can be assumed to be the making of ice cream).
- Measurements are not recorded (0 points).
- The steps of the investigation are not logical enough to repeat the procedure effectively (0 point).
- No repeated trails, experimental control, nor any validity measures were stated (no points).
The Science of Ice Cream
Annotated Example of a 0-point response for item number 5:
5 Tonya and Jacob read that premium ice creams contain a higher content of milk fat. They planned an investigation to see if making ice cream from various types of milk requires more time. Using the following materials, plan their investigation.
Materials:
electric ice cream maker
ice
salt
3 types of milk; nonfat, 1% fat, and 2% fat
cream
sweetener
flavoring
thermometer
Be sure to include:
- Investigative question
- Hypothesis
- Procedure that includes:
- logical steps to perform the investigation
- two controlled variables (kept the same)
- one manipulated variable (changed)
- one responding variable (dependent)
- an experimental control
- how often measurements are taken and recorded
Use words, labeled pictures, and/or labeled diagrams in your response.
| Question: Do you think by using a different kind of milk will change |
| the ice cream? |
| Hypothesis: I don’t think that the milk will really change the out |
| come of the ice cream. |
The Science of Ice Cream
Annotated Example of a 0-point response for item number 5 (continued):
You may use the space below for a labeled diagram to support your procedure.
| Procedure: The materials you will need is electric ice cream maker, |
| ice, salt, 2% fat milk, cream, sweetener, flavoring, thermomter. |
| Put the ice and salt in the outer container then add all of the |
| ingredents. The controlled variables are kept the same. The one |
| manipulated varible is changed. The one responding varible is |
| dependent. Take the measurements as often as liked to be |
| recorded. |
The Science of Ice Cream
An annotation for the sample 0-point response for item 5:
The response shows almost no ability to plan a scientific investigation. The response plans an investigation that earns 0 value points for 0 score points.
- The investigative question states the manipulated variable “different kinds of milk” but the “change” that the kinds of milk may cause is not specified (0 point).
- The null hypothesis is stated in a vague manner but the “change” is not specific (0 point) and no reasons are given (0 point) .
- Stating, “the controlled variables are kept the same” cannot be credited (0 point).
- Stating, “the manipulated variable is changed” cannot be credited (0 point).
- Stating, “the responding variable is dependent” cannot be credited (0 point).
- Stating, “Take the measurements as often as liked to be recorded” cannot be credited (0 point).
- The steps of the investigation are not logical enough to repeat the procedure effectively
(0 point).
- No repeated trails, experimental control, nor any validity measures were stated (no points).
2003 Released Science Scenario with Items
Plant and Animal Interdependence Summary
| Title: Plant and Animal Interdependence | Grade: 10 |
| Description: In a science class, students investigate the interdependence of plans and animals by measuring the level of carbon dioxide in water as an aquatic plant is replaced by an aquatic animal. |
Item Descriptor |
EALR Strand, Learning Target,
and Item Characteristic
|
Item Type |
Properties of Systems
|
Structure
of Systems |
Changes in Systems
|
Inquiry
in Science |
DesigningSolutions
|
Multiple Choice |
Short Answer |
Extended Response
|
|
6
|
Identify how the matter input of photosynthesis
(C02)
might affect a stream ecosystem |
CH03
1.3.8
a |
A |
7
| Predict what logically might happen if the investigation was changed. | IN03
2.1.3
j |
A |
8
| Describe how Jar A in the investigation functions as the experimental control |
IN02
2.1.1
a |
SA |
|
9
| Predict what logically might happen if a different aquatic plant were used in the same investigation. |
IN03
2.1.3
j |
SA |
|
Total
| 2
|
2 |
0 |
Ideal Totals |
3-6 | 1-2
| 0-1
|
Plant and Animal Interdependence
Directions: Use the following information to answer numbers 6 through 9.
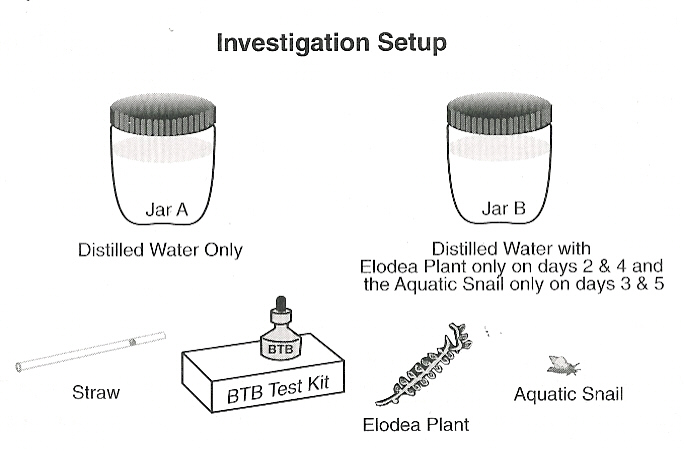
In science class, Enrico and Tina were studying the interdependence of plants and animals. They decided to investigate the interdependence between Elodea, a small water plant, and an aquatic snail, an animal. They discovered that a testing solution called bromothymol blue (BTB) turns from blue to yellow in the presence of high carbon dioxide (CO 2 ). So they did the following investigation using bromothymol blue (BTB) to test for high carbon dioxide (CO2 ) in water as an Elodea plant is added then replaced repeatedly with an aquatic snail over a 5-day period.
Question:
How will the amount of carbon dioxide (CO 2 ) in water change as an aquatic plant is replaced by an aquatic animal?
Hypothesis:
If Elodea is alone in water high in carbon dioxide (CO 2 ), the carbon dioxide (CO 2 ) level will drop because plants breathe in carbon dioxide (CO 2 ).
Materials:
2 jars with airtight lids
distilled water
a straw
an Elodea plant
an aquatic snail
a bromothymol blue (BTB) testing kit
Plant and Animal Interdependence
Procedure:
- Fill the jars with equal amounts of water. Label them A and B on the morning of day 1.
- Through a straw, exhale equally into both jars to create a high presence of carbon dioxide (CO2 ), replace the lids, and place both jars in sunlight.
- In the afternoon, add 5 drops of bromothymol blue (BTB) to both jars and record the color of the water in the data table.
- In the morning of day 2, add the Elodea plant to Jar B. In the afternoon of the same day, observe both jars and record the color in the data table.
- In the morning of day 3, replace the Elodea plant with the snail in Jar B. In the afternoon of the same day, observe both jars and record the color of the water in the data table.
- In the morning of day 4, replace the snail with the Elodea plant in Jar B. In the afternoon of the same day, observe both jars and record the color of the water in the data table.
- In the morning of day 3, replace the Elodea plant with the snail in Jar B. In the afternoon of the same day, observe both jars and record the color of the water in the data table.
Data:
Color of Water in Jars
Day |
Jar A | Jar B
|
Morning Change |
Afternoon Color |
Morning Change | Afternoon Color
| |
1 |
None | Yellow
| None
|
Yellow |
2 |
None | Yellow
|
Add Elodea |
Blue |
3 | None
| Yellow
|
Replace Elodea with snail |
Yellow |
4 | None
| Yellow
|
Replace snail with Elodea |
Blue |
5 | None
| Yellow
|
Replace Elodea with snail |
Yellow |
Plant and Animal Interdependence
Directions: Use the following information to answer numbers 6 through 9.
6 Based on the results of the investigation, what would happen to the concentration of carbon dioxide (CO2 ) in the water of a stream if there was not enough plant life in a stream?
- A. It would increase because plants would not “breathe” in carbon dioxide (CO2).
- B. It would decrease because animals would breathe in carbon dioxide (CO2 ).
- C. It would decrease because animals would exhale out carbon dioxide (CO 2).
- D. It would increase because plants would “exhale” out carbon dioxide (CO2).
Item information:
Correct Response: A
EALR Strand: CH Changes in Systems
Learning Target: CH03 1.3.8 Life Processes and the Flow of Matter and Energy
Explain how organisms can sustain life by obtaining, transporting, transforming, releasing, and eliminating matter and energy.
Item Characteristic: a: Given an adequate description and/or a labeled picture/diagram of an appropriate living system, items may ask students to identify or describe, at a conceptual level, the matter and energy inputs and outputs of photosynthesis.
Performance Data Use the space below to fill in student performance information for your school, your district, and state.
Item 6 Percent Distribution of Responses
|
Item 6
Responses
* correct response |
School |
District | State
| |
|
*A | |||
B | |||
C
| |||
D | |||
NR
(No Response) |
Plant and Animal Interdependence
7 Several Elodea plants and a snail were placed in a large aquarium. The system was then covered with an airtight cover and placed in sunlight. Based on the investigation, which of the following would you expect to happen?
- A. The organisms will balance the carbon dioxide (CO2 ) level in the water.
- B. The carbon dioxide (CO2 ) level in the air will increase and build up inside the cover.
- C. The organisms will soon die from lack of fresh water in the system.
- D. The plants will create sugar, which will increase the mass in the system.
Item information:
Correct Response: A
EALR Strand: IN Inquiry in Science
Learning Target: IN03 2.1.3 Explaining
Formulate and revise scientific explanations and models using logic and evidence; recognize and analyze alternate explanations and predictions.
Item Characteristic: j: Given a completed investigation or description of a phenomenon, items may ask students to predict what logically might happen if the investigation lasted longer or was changed.
Performance Data Use the space below to fill in student performance information for your school, your district, and state.
Item 7 Percent Distribution of Responses
|
Item 7
Responses
* correct response |
School |
District | State
| |
|
*A | |||
B | |||
C
| |||
D | |||
NR
(No Response) |
Plant and Animal Interdependence
8 What is the function of Jar A in this investigation? Why is it needed?
Plant and Animal Interdependence
8 (continued)
Item information:
Score Points: 2
EALR Strand: IN Inquiry in Science
Learning Target: IN02 2.1.2 Planning and Conduction Investigations
Plan, conduct, and evaluate systematic and complex scientific investigations, using appropriate technology, multiple measures, and safe approaches.
Item Characteristic: a: Given a description of a scientific investigation and investigation results, items may ask students to identify or describe the experimental control.
Performance Data Use the space below to fill in student performance information for your school, your district, and state.
Item 8 Percent Distribution of Score Points
|
Item 8
Score Points |
School |
District | State
| |
|
0 | |||
1 | |||
2
| |||
NR
(No Response) | |||
|
Mean |
Plant and Animal Interdependence
Scoring Rubric for item number 8:
A 2-point response : The student shows the ability to evaluate a systematic and complex scientific investigation.
The student states that Jar A functions as the experimental control for the investigative
AND
Explains that Jar A is needed as a basis for comparison to insure that the changes in the water in Jar B are due to the manipulated variable (plant or animals).
Example:
Jar A is an experimental control. The water in Jar A serves as a comparison to establish that BTB does not change colors automatically.
A 1-point response: The student shows some ability to evaluate a systematic and complex scientific investigation.
The student states Jar A is the experimental control but does not give a clear explanation of why it is needed.
OR
The student does not indicate the function of Jar A but does give a clear explanation of why it is needed.
A 0-point response: The student shows little or no ability to evaluate a systematic and complex scientific investigation.
Notes:
- The phrase “experimental control” is not required.
- The response “to see if there is something wrong with the experiment” is not sufficient to credit explaining why Jar A is needed.
- If the response states “Jar A is the control”, but the explanation indicates the student does not understand the concept of an experimental control, the score point is negated.
Plant and Animal Interdependence
Annotated Example of a 2-point response for item number 8:
8 What is the function of Jar A in this investigation? Why is it needed?
| Jar A is the control jar of the experiment. Enrico & Tanya would |
| need a control jar to see what would happen to the C02 levels of |
| water with neither plans nor animals in it. If the jar’s color |
| changed for some reason, then the experiment wouldn’t work as |
| well. the contents of jar A stayed the same, which made it a good |
| control in this experiment. The jar’s purpose is to show what would |
| happen if there were no variables involved with the water. It was |
| used as a comparison to the jar of water with the elodea & snail. |
Annotation:
This response demonstrates that the student shows the ability to evaluate a systematic and complex scientific investigation.
The response states, ”Jar A is the control jar of the experiment.” (1 point)
The response explains, in detail, why an experimental control is needed (1 point)
Plant and Animal Interdependence
Annotated Example of a 1-point response for item number 8:
8 What is the function of Jar A in this investigation? Why is it needed?
| Jar A is a control, it is meant as a comparison tool to Jar B. |
Annotation:
This response demonstrates that the student shows some ability to evaluate a systematic and complex scientific investigation.
The response states, ”Jar A is the control ” (1 point)
The response explains why an experimental control by stating, ”it is meant as a comparison tool to the Jar B” . This explanation is incomplete. An explanation needs to give the details of the comparison, not simply state the definition of an experimental control. (0 point)
Plant and Animal Interdependence
Annotated Example of a 0-point response for item number 8:
8 What is the function of Jar A in this investigation? Why is it needed?
| The function of Jar A is used by the snail and no Elodea plant. So |
| it would be holding carbon dioxide. |
Annotation:
This response demonstrates that the student shows little to no ability to evaluate a systematic and complex scientific investigation.
The response states, ”Jar A is used by the snail and no Elodea plant” which is not the case, Jar A had no plant or animal (0 point).
The reason given, ”So it would be holding carbon dioxide.” This response cannot be credited. (0 point)
Plant and Animal Interdependence
9 In the investigation, the distilled water/BTB solution always turned blue when the Elodea plant was placed in the jar.
- Predict whether placing a different aquatic plant in the jar would have the same effect.
- Explain your prediction.
Plant and Animal Interdependence
9 (continued)
Item information:
Score Points: 2
EALR Strand: IN Inquiry in Science
Learning Target: IN03 2.1.3 Explaining
Formulate and revise scientific explanations and models using logic and evidence; recognize and analyze alternate explanations and predictions.
Item Characteristic: j: Given a completed investigation or description of a phenomenon, items may ask students to predict what logically might happen if the investigation lasted longer or was changed.
Performance Data Use this space to fill in student performance information for your school, your district, and state.
Item 9 Percent Distribution of Score Points
|
Item 9
Score Points |
School |
District | State
| |
|
0 | |||
1 | |||
2
| |||
NR
(No Response) | |||
|
Mean |
Plant and Animal Interdependence
Scoring Rubric for item number 9:
A 2-point response: The student shows the ability to formulate a scientific explanation based upon evidence and logic.
The student states that a different aquatic plant would have the same effect and gives a reason/explanation or states that a different plant would have a different effect and gives a reason/explanation (smaller plant – less surface area for exchange of gases, etc).
Examples:
1. A different aquatic plant will also take carbon dioxide from the surroundings. Therefore, it will cause the same result as Elodea.
2. A different aquatic plant might make a little bit of a difference in the investigation because a plant that photosynthesizes faster or slower than Elodea would change the color of the water at a different rate.
A 1-point response: The student shows some ability to formulate a scientific explanation based upon evidence and logic.
The student states that any aquatic plant would have the same effect, but the explanation contains minor errors or is vague.
A 0-point response: The student shows little or no ability to formulate a scientific explanation based upon evidence and logic.
Plant and Animal Interdependence
Annotated Example of a 2-point response for item number 9:
9 In the investigation, the distilled water/BTB solution always turned blue when the Elodea plant was placed in the jar.
- Predict whether placing a different aquatic plant in the jar would have the same effect.
- Explain your prediction.
| A different aquatic plant should have the same effect on the color |
| because all plants take in CO2 and give off O2 . This means that |
| any other plant should take in all or some of the CO2 in the jar |
| and make the test show blue. |
Annotation:
This response demonstrates that the student shows the ability to formulate a scientific explanation based upon evidence and logic.
The response states a plausible prediction, “ should have the same effect” (1 point)
The response explains, in detail the prediction (1 point).
Plant and Animal Interdependence
Annotated Example of a 1-point response for item number 9:
9 In the investigation, the distilled water/BTB solution always turned blue when the Elodea plant was placed in the jar.
- Predict whether placing a different aquatic plant in the jar would have the same effect.
- Explain your prediction.
| If you placed a different aquatic plant in the jar it would most |
| likely have the same effect. That’s because the aquatic plants |
| stay alive in similar ways. |
Annotation:
This response demonstrates that the student shows some ability to formulate a scientific explanation based upon evidence and logic.
The response states a plausible prediction “ would most likely have the same effect” (1 point).
The response explains the prediction by stating “aquatic plants stay alive in similar ways .” This prediction is too vague to credit (0 point).
Plant and Animal Interdependence
Annotated Example of a 0-point response for item number 9:
9 In the investigation, the distilled water/BTB solution always turned blue when the Elodea plant was placed in the jar.
- Predict whether placing a different aquatic plant in the jar would have the same effect.
- Explain your prediction.
| I think if you placed a different aquatic plant, the results would |
| change. Different plants have different effects. Some need |
| sunlight and some don’t. If she used a different plant it would |
| probably die. |
Annotation:
This response demonstrates that the student shows little to no ability to formulate a scientific explanation based upon evidence and logic.
The response states a prediction too vague to credit, “ the results would change” (0 point).
The response explains the vague prediction by stating, “Different plants have different effects .” This explanation is too vague to credit. The response goes on and perhaps demonstrates some misconceptions of plant systems (0 point).
Ocean Water and Subducting Tectonic Plates
An Earth systems multiple choice stand-alone item
10 Since ocean water is drawn down with subducting plates, what is one reason why oceans still exist?
- A. Water carried to Earth’s interior during the sinking of oceanic crust is replaced by
water from meteors.
- B. Water contained in the subducting oceanic crust is recycled to the surface through
volcanic action.
- C. Subduction rates are slow enough that rainfall can compensate for the subducted
water.
- D. As Earth sweeps through space during its orbit of the Sun, it gains water from the
outer atmosphere.
Item information:
Correct Response: B
EALR Strand: ST Structure of Systems
Learning Target: ST02 1.2.4 Components and Patterns of Earth Systems
Describe the patterns and arrangements of the Earth system including the solid Earth, hydrosphere, and layers of the atmosphere.
Item Characteristic: a: Given an adequate description and/or a labeled picture/diagram of an appropriate Earth system, items may ask students to describe the interactions among the parts of Earth’s system(s), such as the atmosphere and the hydrosphere (weather), or the hydrosphere and the lithosphere (plate tectonics/rock cycle).
Ocean Water and Subducting Tectonic Plates
An Earth systems multiple choice stand-alone item
10 (continued)
Performance Data Use the space below to fill in student performance information for your school, your district, and state.
Item 10 Percent Distribution of Responses
|
Item 10
Responses
* correct response |
School |
District | State
| |
|
A | |||
*B | |||
C
| |||
D | |||
NR
(No Response) |
Page 50 of 52