| | A | B | C | D | E | F | G | H | I | J | K | L | M | N | P | Q | R | S | T | U | V | W | X |
|---|
| 1 | |
EVERETT PUBLIC SCHOOL |
|---|
| 2 | |
Workplace Support - Utilization Services |
|---|
| 3 | |
Report Period: 10/01/2010 - 12/31/2010 |
|---|
| 4 | | | | | | | | | |

| | | | | | | | | | |
|---|
| 5 | | | | | | | | | | | | | | | | | | | | | | | |
|---|
| 6 | | | | | | | | | | | | | | | | | | | | | | | |
|---|
| 7 | | | | | | | | | | | | | | | |
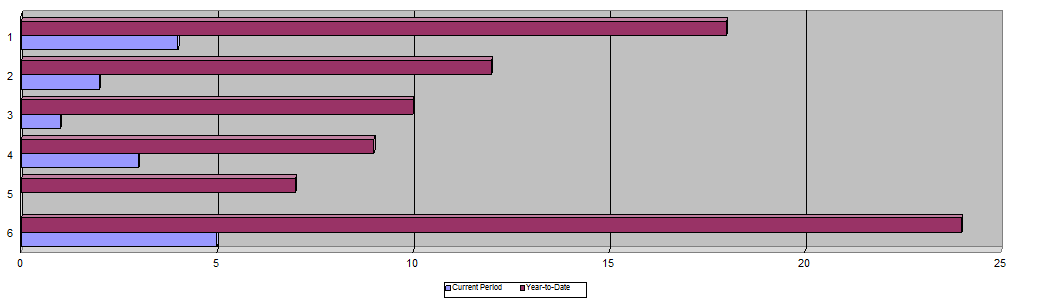
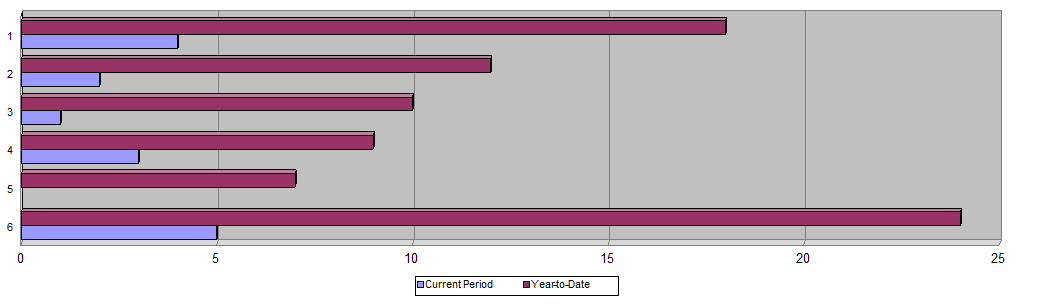
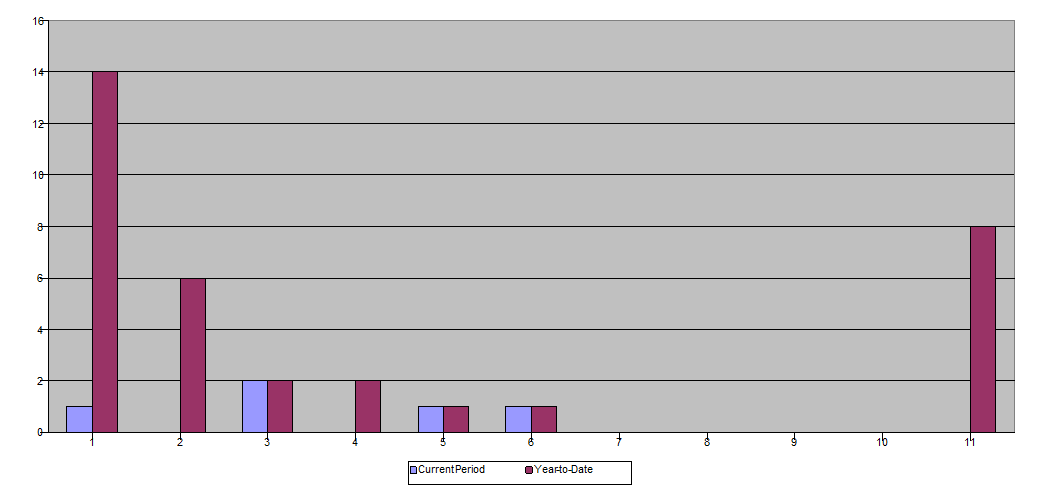
Current Period |
Year-to-Date |
|---|
| 8 | | | | | | | | | | | | | | |
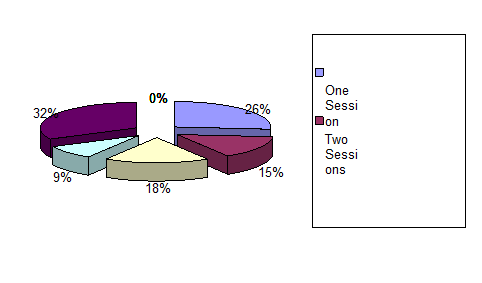
Case Type |
Number |
% of Total |
Number |
% of Total |
|---|
| 9 | | | | | | | | | | | | | | |
Consultation Only |
1 |
100.0% |
0.0% |
1 |
33.3% |
0.0% |
|---|
| 10 | | |
Current Period |
Year-to-Date |
YTD Norm |
Consult w/Mandatory Referral |
0 |
0.0% |
0.0% |
2 |
66.7% |
0.0% |
|---|
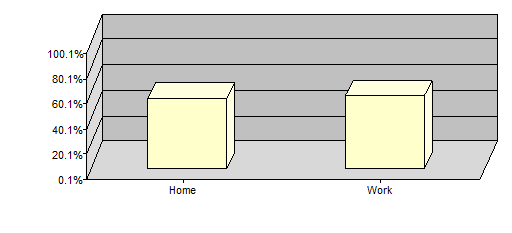
| 11 | |
Utilization Summary |
Number |
Number |
All Models |
Consult w/Voluntary Referral |
0 |
0.0% |
0.0% |
0 |
0.0% |
0.0% |
|---|
| 12 | |
New Cases** |
0 |
2 |
- |
Other |
0 |
0.0% |
0.0% |
0 |
0.0% |
0.0% |
|---|
| 13 | |
**Annualized Utilization |
0.0% |
0.1% |
0.1% |
Total |
1 |
100% |
3 |
100% |
|---|
| 14 | | | | | | | | | | | | | | | | | | | | | | | |
|---|
| 15 | | | | | | | | | | | | | | | | | | | | | | | |
|---|
| 16 | | |
Current Period |
Year-to-Date | |
Drug |
Alcohol |
|---|
| 17 | |
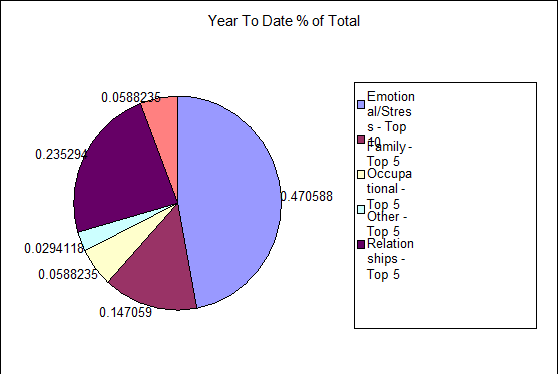
Reason for Referral - TOP 5 |
Number |
% of Total |
TOV |
Number |
% of Total |
TOV |
Testing Results |
Current |
YTD |
Current |
YTD |
|---|
| 18 | |
Threat of Self Harm |
0 |
0.0% |
0.0% |
0 |
1 |
50.0% |
0.0% |
0 |
Random - Positive Test |
0 |
0 |
0 |
0 |
|---|
| 19 | |
Threat of Violence |
0 |
0.0% |
0.0% |
0 |
1 |
50.0% |
0.0% |
0 |
For Cause - Positive Test |
0 |
0 |
0 |
0 |
|---|
| 20 | | |
0 |
0.0% |
0.0% |
0 |
0 |
0.0% |
0.0% |
0 |
Post Accident - Positve Test |
0 |
0 |
0 |
0 |
|---|
| 21 | | |
0 |
0.0% |
0.0% |
0 |
0 |
0.0% |
0.0% |
0 |
Pre-Employment - Positive Test |
0 |
0 |
0 |
0 |
|---|
| 22 | | |
0 |
0.0% |
0.0% |
0 |
0 |
0.0% |
0.0% |
0 |
Self Reported - Positive Test |
0 |
0 |
0 |
0 |
|---|
| 23 | | |
0 |
0.0% |
0.0% |
0 |
0 |
0.0% |
0.0% |
0 |
Negative Test |
0 |
0 |
0 |
0 |
|---|
| 24 | |
Total |
0 |
0% |
0 |
2 |
100% |
0 |
Total |
0 |
0 |
0 |
0 |
|---|
| 25 | | | | | | | | | | | | | | | | | | | | | | | |
|---|
| 26 | | | | | | | | | | | | | | | | | | | | | | | |
|---|
| 27 | | |
Current Period |
Year-to-Date | | | | | | | | | |
|---|
| 28 | |
Supervisor Referral Job Category |
Number |
% of Total |
Number |
% of Total | | | | | | | | | |
|---|
| 29 | |
Clerical/Support Staff |
0 |
0.0% |
0 |
0.0% | | | | | | | | | |
|---|
| 30 | |
Labor Manufacturing Operator |
0 |
0.0% |
0 |
0.0% | | | | | | | | | |
|---|
| 31 | |
Customer Service |
0 |
0.0% |
0 |
0.0% | | | | | | | | | |
|---|
| 32 | |
Housekeeping/Maintenance |
0 |
0.0% |
1 |
50.0% | | | | | | | | | |
|---|
| 33 | |
Sales/Marketing |
0 |
0.0% |
0 |
0.0% | | | | | | | | | |
|---|
| 34 | |
Professional |
0 |
0.0% |
1 |
50.0% | | | | | | | | | |
|---|
| 35 | |
Manager/Supervisor |
0 |
0.0% |
0 |
0.0% | | | | | | | | | |
|---|
| 36 | |
Technical/Equipment Service |
0 |
0.0% |
0 |
0.0% | | | | | | | | | |
|---|
| 37 | |
Other |
0 |
0.0% |
0 |
0.0% | | | | | | | | | |
|---|
| 38 | |
Total |
0 |
0% |
2 |
100% | | | | | | | | | |
|---|
| 39 | | | | | | | | | | | | | | | | | | | | | | | |
|---|
| 40 | | | | | | | | | |

| | | | | | | | | | |
|---|
| 41 | | | | | | | | | | | | | | | | | | | |
|---|
| 42 | | | | | | | | | | | | | | | | | | | | | | | |
|---|
| 43 | | |
Current Period |
Year-to-Date | |
Current Period |
Year-to-Date |
|---|
| 44 | |
Supervisor Referral Closing Resolution |
Number |
% of Total |
Number |
% of Total |
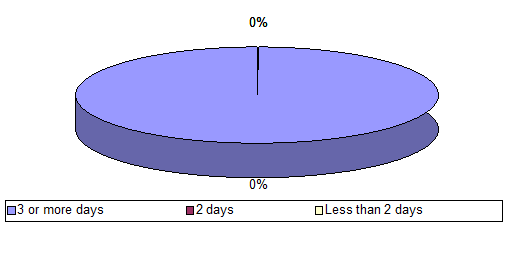
Average Calls per Case |
Average |
Average |
|---|
| 45 | |
Successful Completion |
0 |
0.0% |
2 |
100.0% |
Consultation Only |
1.0 |
1.0 |
|---|
| 46 | |
Reported Non-Compliant; Case Closed |
0 |
0.0% |
0 |
0.0% |
Consultation W/Mandatory Referral |
0.0 |
14.5 |
|---|
| 47 | |
Terminated From Employment |
0 |
0.0% |
0 |
0.0% |
Consultation W/Voluntary Referral |
0.0 |
0.0 |
|---|
| 48 | |
Client Declined Services |
0 |
0.0% |
0 |
0.0% |
Other |
0.0 |
0.0 |
|---|
| 49 | |
Client Left Employment |
0 |
0.0% |
0 |
0.0% | | | | | | | | | |
|---|
| 50 | |
Company Directed to Close Referral |
0 |
0.0% |
0 |
0.0% | | | | | | | | | |
|---|
| 51 | |
Other |
0 |
0.0% |
0 |
0.0% | | | | | | | | | |
|---|
| 52 | |
Closed Cases |
0 |
0% |
2 |
100% | | | | | | | | | |
|---|
| 53 | |
Consultation Only |
1 | | | |
1 | | | | | | | | | | | | |
|---|
| 54 | |
Total Cases/Consultations |
1 | | | |
3 | | | | | | | | | | | | |
|---|