
Contents
| Introduction and Overview | 1 |
| Key to the Notes | 1 | |
| Highlights of the Local Results | 2 | |
| Selected Results by Gender | 3 | |
| General Information (Items 1–14) | 4 |
| Alcohol, Tobacco, and Other Drug (ATOD) Use | 6 |
| Lifetime Use (Items 15–23) | 6 | |
| 30-Day Use (Items 24–33) | 7 | |
| Other Tobacco-Related Questions (Items 34–49) | 9 | |
| Other Alcohol- and Drug-Related Questions (Items 50–62) | 11 | |
| Other Health Concerns | 14 |
| Nutrition and Fitness (Items 63–78) | 14 | |
| Health Conditions and Health Care (Items 79–88) | 17 | |
| Sexual Behavior (Items 89–92) | 19 | |
| Safety (Items 93–99) | 19 | |
| Behaviors Related to Intentional Injuries (Items 100–109) | 20 | |
| Depression (Items 110–119) | 21 | |
| Gambling (Items 120–121) | 23 | |
| School Climate (Items 122–135) | 23 |
| Quality of Life (Items 136–146) | 25 |
| Risk and Protective Factors | 28 |
| Risk and Protective Factor Framework and Reporting Schedule | 29 | |
| Risk and Protective Factor Scale Results | 30 | |
| Graph of Scale Results | 32 | |
| Risk and Protective Factors: Individual Item Results | 33 |
| Community Domain (Items 147–167) | 33 | |
| Family Domain (Items 168–185) | 35 | |
| School Domain (Items 186–203) | 38 | |
| Peer and Individual Domain (Items 204–256) | 41 | |
| List of Core Items | 50 |
| Item Index | 50 |
Healthy Youth Survey 2010
Survey Results
Cascade High School (Everett School District), Grade 10
| Number of students surveyed: | 357 |
| Number of valid responses: | 346 |
| Estimate of enrolled students:* | 486 |
| Survey participation rate:** | 71% |
| · 70% or greater participation–Results are probably representative of students in this grade. | |
| · 40–69% participation–Results may be representative of students in this grade. | |
| · Less than 40% participation–Results are likely not representative of students in this grade but do reflect students who completed the survey. |
Key to the Notes
The survey was administered in 4 versions: Forms A and B (or alternate Form NS, identical to Form B but without the sexual behavior questions) were administered to students in Grades 8, 10, and 12. Forms A and B (or NS) contained a core set of common items (see “List of Core Items” on the last page of this report) and additional items unique to each form. Form C was administered to students in Grade 6. This form consisted primarily of items drawn from Forms A and B but also included some unique items. Several items on each form were optional at the discretion of the school; schools that did not administer the optional items tore off the last page of the survey booklet. The following notes are used throughout this report to document the differences between the items on different versions and indicate the optional items:
A = wording on Form A
B = wording on Form B (and NS)
C = wording on Form C
† = optional item
* Estimate of enrolled students based on figures from the 2008–2009 school year, provided by OSPI (or later if school not in 2008 enrollment file).
** Participation rate = valid responses ÷ enrolled students (may be >100% if enrollment greater in 2010 than 2008).
Cascade High School (Everett School District) Grade 10
Highlights of the Local Results
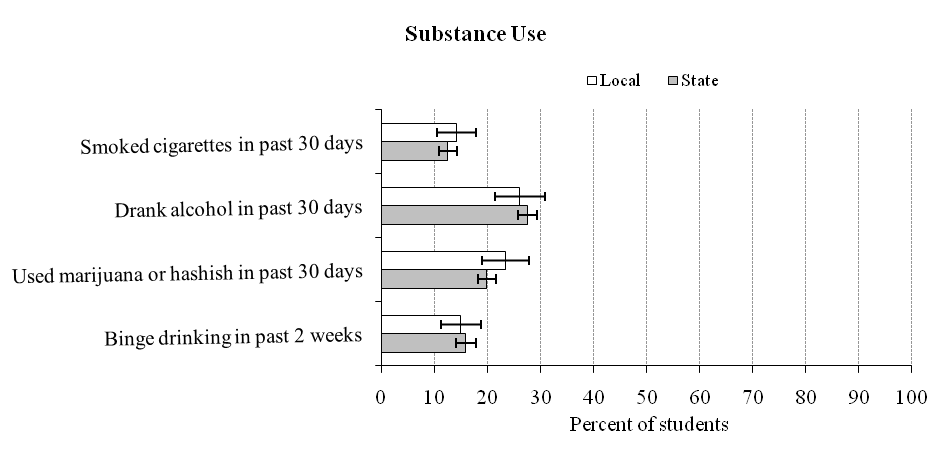
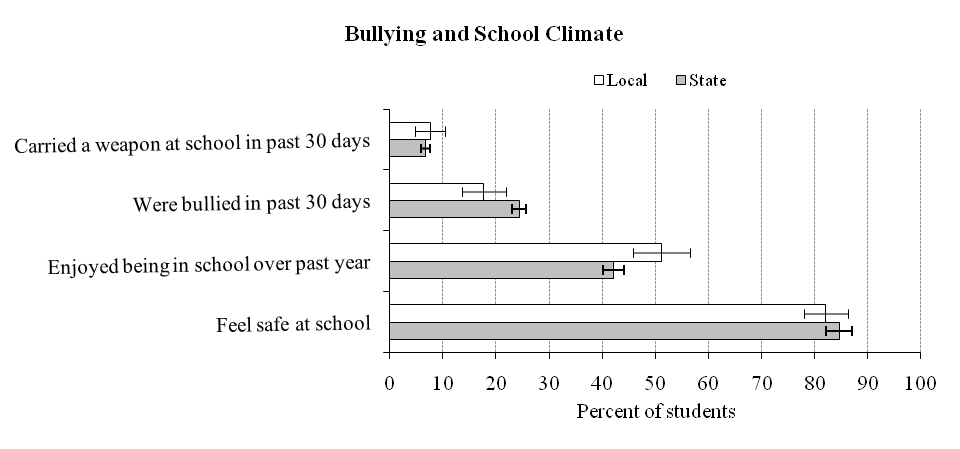
Your students and students statewide reported the following behaviors and attitudes:
Your students | Statewide
|
| § Smoking cigarettes in the past 30 days (see item 24). | 14.2% | (± 3.7%) | 12.4% | (± 1.7%) |
| Drinking alcohol in the past 30 days (see item 28). | 26.0 | (± 4.7) | 27.5 | (± 1.8) |
| Using marijuana or hashish in the past 30 days (see item 29). | 23.4 | (± 4.5) | 19.9 | (± 1.7) |
| Drinking five or more drinks in a row in the past 2 weeks (see item 55). | 14.9 | (± 3.8) | 15.9 | (± 1.8) |
| Carrying a weapon at school in the past 30 days (see item 102). | 7.6 | (± 2.8) | 6.8 | (± 0.8) |
| Being bullied in the past 30 days (see item 122). | 17.7 | (± 4.1) | 24.4 | (± 1.3) |
| Enjoyed being in school over the past year (see item 191). | 51.2 | (± 5.3) | 42.2 | (± 2.0) |
| Feeling safe at school (see item 202). | 82.2 | (± 4.1) | 84.6 | (± 2.4) |


Selected Results by Gender
Selected items are presented by gender to highlight any differences between females and males. The p-values reported after each item can be used to examine whether differences in the local data between females and males are statistically significant. A p-value of less than .05 means, for the local results, there is a significant difference between females and males (i.e., the probability that the difference occurred by chance is less than 5%). To ensure student anonymity, local results are suppressed for each item on this page if any cell (e.g., females who reported smoking) represented fewer than 10 students.
| During the past 30 days, on how many days did you smoke cigarettes? (See item 24.) | Local
(n = 337) | State
(n = 7,139) |
Female
| Male
| Female
| Male
| |
| None | 89.8% | 81.4% | 88.1% | 87.0% |
| 1 or more | 10.2 | 18.6 | 11.9 | 13.0 |
| During the past 30 days, on how many days did you drink a glass, can or bottle of alcohol (beer, wine, wine coolers, hard liquor)? (See item 28.) | Local
(n = 336) | State
(n = 7,122) |
Female
| Male
| Female
| Male
| |
| None | 74.3% | 73.9% | 71.3% | 73.8% |
| 1 or more | 25.7 | 26.1 | 28.7 | 26.2 |
| Think back over the last 2 weeks. How many times have you had five or more drinks in a row? (A drink is a glass of wine, a bottle of beer, a shot glass of liquor, or a mixed drink.) (See item 55.) | Local
(n = 334) | State
(n = 7,065) |
Female
| Male
| Female
| Male
| |
| None | 88.0% | 81.8% | 84.5% | 83.8% |
| Once or more | 12.0 | 18.2 | 15.5 | 16.2 |
| During the past l2 months, did you ever feel so sad or hopeless almost every day for two weeks or more in a row that you stopped doing some usual activities? (See item 110.) | Local
(n = 329) | State
(n = 6,878) |
Female
| Male
| Female
| Male
| |
| No | 69.0% | 73.6% | 66.0% | 75.1% |
| Yes | 31.0 | 26.5 | 34.0 | 24.9 |
| In the last 30 days, how often have you been bullied? (See item 122.) | Local
(n = 331) | State
(n = 6,991) |
Female
| Male
| Female
| Male
| |
| I have not been bullied | 85.6% | 79.1% | 73.7% | 77.9% |
| Once or more | 14.5 | 20.9 | 26.4 | 22.1 |
| I feel safe at my school. (See item 202.) | Local
(n = 340) | State
(n = 7,169) |
Female
| Male
| Female
| Male
| |
| No | 13.5% | 22.8% | 13.5% | 17.4% |
| Yes | 86.5 | 77.2 | 86.5 | 82.6 |
General Information
| 1. How old are you? | Local
(n = 345) | State
(n = 7,245) |
| a. 12 or younger | 0.0% | (± 0.0%) | 0.1% | (± 0.1%) |
| b. 13 | 0.0 | (± 0.0) | 0.0 | (± 0.0) |
| c. 14 | 2.6 | (± 1.7) | 1.4 | (± 0.4) |
| d. 15 | 71.6 | (± 4.8) | 70.3 | (± 1.7) |
| e. 16 | 25.2 | (± 4.6) | 26.9 | (± 1.5) |
| f. 17 | 0.3 | (± 0.6) | 1.2 | (± 0.4) |
| g. 18 | 0.0 | (± 0.0) | 0.1 | (± 0.1) |
| h. 19 or older | 0.3 | (± 0.6) | 0.1 | (± 0.0) |
| 3. Are you: | Local
(n = 344) | State
(n = 7,237) |
| a. Female | 52.0% | (± 5.3%) | 52.4% | (± 1.0%) |
| b. Male | 48.0 | (± 5.3) | 47.6 | (± 1.0) |
| 4. How do you describe yourself? (Select one or more responses.) | Local
(n = 341) | State
(n = 7,194) |
| a. American Indian or Alaskan Native | 11.4% | (± 3.4%) | 7.9% | (± 2.9%) |
| b. Asian or Asian American | 1.2 | (± 1.1) | 2.0 | (± 0.4) |
| c. Black or African-American | 6.2 | (± 2.5) | 4.1 | (± 1.1) |
| d. Hispanic or Latino/Latina | 7.9 | (± 2.9) | 13.7 | (± 6.1) |
| e. Native Hawaiian or other Pacific Islander | 2.4 | (± 1.6) | 2.1 | (± 0.7) |
| f. White or Caucasian | 55.4 | (± 5.3) | 57.4 | (± 5.8) |
| g. Other | 8.2 | (± 2.9) | 5.6 | (± 0.7) |
| More than one race/ethnicity marked | 7.3 | (± 2.8) | 7.1 | (± 0.9) |
| 5. What language is usually spoken at home? | Local
(n = 337) | State
(n = 7,003) |
| a. English | 80.1% | (± 4.3%) | 81.2% | (± 4.2%) |
| b. Spanish | 4.8 | (± 2.3) | 8.8 | (± 3.8) |
| c. Russian | 3.3 | (± 1.9) | 1.1 | (± 0.3) |
| d. Ukrainian | 1.5 | (± 1.3) | 0.9 | (± 0.3) |
| e. Vietnamese | 2.4 | (± 1.6) | 1.4 | (± 0.8) |
| f. Chinese | 0.6 | (± 0.8) | 1.6 | (± 0.7) |
| g. Korean | 1.2 | (± 1.2) | 0.9 | (± 0.3) |
| h. Japanese | 0.0 | (± 0.0) | 0.3 | (± 0.1) |
| i. Other | 6.2 | (± 2.6) | 3.8 | (± 1.1) |
| 7. How far did your mother get in school? | Local
(n = 335) | State
(n = 7,004) |
| a. Did not finish high school | 8.4% | (± 3.0%) | 11.7% | (± 2.9%) |
| b. Graduated from high school or GED | 20.3 | (± 4.3) | 19.5 | (± 1.9) |
| c. Had some college or technical training after high school | 33.1 | (± 5.0) | 23.1 | (± 1.5) |
| d. Graduated from a 4-year college | 13.1 | (± 3.6) | 20.9 | (± 3.2) |
| e. Earned an advanced graduate degree | 6.3 | (± 2.6) | 9.9 | (± 1.8) |
| f. Don’t know | 15.5 | (± 3.9) | 12.3 | (± 1.2) |
| g. Does not apply | 3.3 | (± 1.9) | 2.6 | (± 0.5) |
| 8. How far did your father get in school? | Local
(n = 333) | State
(n = 6,997) |
| a. Did not finish high school | 12.3% | (± 3.5%) | 12.7% | (± 2.9%) |
| b. Graduated from high school or GED | 17.7 | (± 4.1) | 18.4 | (± 2.1) |
| c. Had some college or technical training after high school | 22.5 | (± 4.5) | 17.2 | (± 1.4) |
| d. Graduated from a 4-year college | 18.9 | (± 4.2) | 19.7 | (± 3.0) |
| e. Earned an advanced graduate degree | 7.8 | (± 2.9) | 13.1 | (± 2.9) |
| f. Don’t know | 18.3 | (± 4.2) | 15.4 | (± 1.7) |
| g. Does not apply | 2.4 | (± 1.6) | 3.6 | (± 0.5) |
| 9. How many hours per week are you currently working for pay, NOT counting chores around your home, yard work, or babysitting? | Local
(n = 163) | State
(n = 3,401) |
| a. None, not currently working | 88.3% | (± 4.9%) | 82.4% | (± 2.1%) |
| b. 10 hours or less a week | 8.0 | (± 4.2) | 11.9 | (± 1.4) |
| c. 11-30 hours a week | 3.1 | (± 2.6) | 3.7 | (± 0.7) |
| d. 31–40 hours a week | 0.0 | (± 0.0) | 1.1 | (± 0.8) |
| e. More than 40 hours a week | 0.6 | (± 1.2) | 0.9 | (± 0.5) |
| 10. Not counting chores around your home, while working for pay, have you ever been injured badly enough that you needed to go to a nurse, doctor, or hospital? | Local
(n = 162) | State
(n = 3,388) |
| a. Never worked for pay | 72.8% | (± 6.8%) | 62.2% | (± 3.5%) |
| b. Have worked, but never injured enough to see nurse or doctor | 26.5 | (± 6.8) | 35.5 | (± 3.3) |
| c. Yes, I was injured at work and needed to go to a nurse, doctor or hospital | 0.6 | (± 1.2) | 2.4 | (± 0.8) |
| 11. How would you describe the type of place that you currently work? (Pick your main job. Choose one.) | Local
(n = 161) | State
(n = 3,382) |
| a. Not currently working | 83.2% | (± 5.8%) | 74.9% | (± 2.4%) |
| b. Restaurant (including fast food) | 3.1 | (± 2.7) | 3.5 | (± 1.0) |
| c. Store (including grocery, convenience, clothing, music, or gift stores, gas station) | 1.2 | (± 1.7) | 2.3 | (± 0.7) |
| d. Hospital, clinic, or nursing home | 0.0 | (± 0.0) | 0.9 | (± 0.4) |
| e. Construction | 0.6 | (± 1.2) | 1.1 | (± 0.4) |
| f. Farm or dairy | 0.6 | (± 1.2) | 1.3 | (± 0.6) |
| g. Factory | 0.0 | (± 0.0) | 0.3 | (± 0.2) |
| h. Packing house or food processing | 0.0 | (± 0.0) | 0.4 | (± 0.2) |
| i. Babysitting | 3.7 | (± 2.9) | 4.9 | (± 0.7) |
| j. Yard work | 1.9 | (± 2.1) | 2.8 | (± 0.7) |
| k. Other | 5.6 | (± 3.5) | 7.6 | (± 1.1) |
| 12. On an average school night, how many hours do you sleep? | Local
(n = 162) | State
(n = 3,390) |
| a. 5 hours or less | 13.6% | (± 5.3%) | 12.8% | (± 1.3%) |
| b. About 6 hours | 28.4 | (± 6.9) | 23.1 | (± 1.5) |
| c. About 7 hours | 26.5 | (± 6.8) | 31.2 | (± 2.0) |
| d. About 8 hours | 27.8 | (± 6.9) | 27.4 | (± 2.1) |
| e. 9 hours or more | 3.7 | (± 2.9) | 5.6 | (± 0.8) |
| 13. On an average weekend night (Friday and Saturday night), how many hours do you sleep? | Local
(n = 163) | State
(n = 3,366) |
| a. 5 hours or less | 12.3% | (± 5.0%) | 15.3% | (± 2.2%) |
| b. About 6 hours | 11.0 | (± 4.8) | 9.5 | (± 1.5) |
| c. About 7 hours | 12.3 | (± 5.0) | 9.4 | (± 1.1) |
| d. About 8 hours | 17.8 | (± 5.9) | 21.7 | (± 1.4) |
| e. 9 hours or more | 46.6 | (± 7.7) | 44.1 | (± 3.3) |
| 14. How honest were you in filling out this survey? | Local
(n = 317) | State
(n = 6,491) |
| a. I was very honest | 84.5% | (± 4.0%) | 84.5% | (± 2.0%) |
| b. I was honest pretty much of the time | 14.8 | (± 3.9) | 12.9 | (± 1.3) |
| c. I was honest some of the time | 0.6 | (± 0.9) | 2.6 | (± 0.8) |
| d. I was honest once in a while | Surveys pulled
|
| e. I was not honest at all | Surveys pulled
|
Alcohol, Tobacco, and Other Drug Use
Alcohol, tobacco, and other drug use has been a major concern in this country for many years. The consequences of ATOD use are well known. In the short term, ATOD use interferes with positive physical, emotional, and social development. In the long term, ATOD use is associated with delinquency and criminal activity, unintended injuries, and a variety of health complications including shorter life expectancy. The economic costs of ATOD use are enormous (in Washington State an estimated $1.81 billion in 1990 $2.54 billion in 1996, and $5.21 billion in 2005). Tobacco use is the world’s leading cause of preventable death, disease, and disability. This section provides information about lifetime ATOD use (which in part reflects experimental use), use in the past 30 days (i.e., current use), and other tobacco-, alcohol-, and drug-related issues.
Lifetime Use
| 15. Have you ever smoked a cigarette, even just a puff? (Computed from item 210.) | Local
(n = 165) | State
(n = 3,468) |
| a. No | 67.3% | (± 7.2%) | 71.2% | (± 2.9%) |
| b. Yes | 32.7 | (± 7.2) | 28.8 | (± 2.9) |
| 16. Have you ever had more than a sip or two of beer, wine, or hard liquor (for example, vodka, whiskey, or gin)? (Computed from item 211 or 212.) | Local
(n = 332) | State
(n = 7,033) |
| a. No | 43.1% | (± 5.3%) | 43.1% | (± 2.2%) |
| b. Yes | 56.9 | (± 5.3) | 56.9 | (± 2.2) |
| 17. Have you ever smoked marijuana? (Computed from item 208 or 209.) | Local
(n = 334) | State
(n = 7,048) |
| a. No | 66.2% | (± 5.1%) | 69.3% | (± 2.4%) |
| b. Yes | 33.8 | (± 5.1) | 30.7 | (± 2.4) |
| 18. Used inhalants? | Local
(n = 166) | State
(n = 3,459) |
| a. No | 91.0% | (± 4.4%) | 91.0% | (± 1.1%) |
| b. Yes | 9.0 | (± 4.4) | 9.0 | (± 1.1) |
| 19. Used heroin? | Local
(n = 166) | State
(n = 3,464) |
| a. No | 95.2% | (± 3.3%) | 96.6% | (± 0.9%) |
| b. Yes | 4.8 | (± 3.3) | 3.4 | (± 0.9) |
| 20. Used methamphetamines (meth, crystal meth, ice, crank)? Do not include other types of amphetamines. | Local
(n = 166) | State
(n = 3,461) |
| a. No | 96.4% | (± 2.8%) | 95.3% | (± 1.2%) |
| b. Yes | 3.6 | (± 2.8) | 4.7 | (± 1.2) |
| 21. Used cocaine? | Local
(n = 166) | State
(n = 3,465) |
| a. No | 92.8% | (± 3.9%) | 94.1% | (± 1.0%) |
| b. Yes | 7.2 | (± 3.9) | 6.0 | (± 1.0) |
| 22. Used steroids (muscle builders) without a doctor’s prescription? | Local
(n = 166) | State
(n = 3,460) |
| a. No | 98.2% | (± 2.0%) | 96.6% | (± 0.9%) |
| b. Yes | 1.8 | (± 2.0) | 3.4 | (± 0.9) |
30-Day Use (Use in the Past 30 Days)
During the past 30 days, on how many days did you:
| 24. Smoke cigarettes? | Local
(n = 339) | State
(n = 7,153) |
| a. None | 85.8% | (± 3.7%) | 87.6% | (± 1.7%) |
| b. 1–2 days | 5.3 | (± 2.4) | 4.2 | (± 0.5) |
| c. 3–5 days | 2.4 | (± 1.6) | 1.9 | (± 0.5) |
| d. 6–9 days | 0.9 | (± 1.0) | 1.3 | (± 0.3) |
| e. 10–29 days | 2.4 | (± 1.6) | 2.0 | (± 0.5) |
| f. All 30 days | 3.2 | (± 1.9) | 3.0 | (± 0.7) |
| Any use in past 30 days | 14.2 | (± 3.7) | 12.4 | (± 1.7) |
| 25. Use chewing tobacco, snuff, or dip? | Local
(n = 338) | State
(n = 7,145) |
| a. None | 93.8% | (± 2.6%) | 94.0% | (± 1.4%) |
| b. 1–2 days | 1.8 | (± 1.4) | 2.5 | (± 0.6) |
| c. 3–5 days | 0.9 | (± 1.0) | 1.1 | (± 0.3) |
| d. 6–9 days | 1.8 | (± 1.4) | 0.8 | (± 0.3) |
| e. 10–29 days | 0.9 | (± 1.0) | 0.8 | (± 0.3) |
| f. All 30 days | 0.9 | (± 1.0) | 0.9 | (± 0.3) |
| Any use in past 30 days | 6.2 | (± 2.6) | 6.0 | (± 1.4) |
| 26. Smoke cigars, cigarillos, or little cigars?† | Local
(n = 170) | State
(n = 3,589) |
| a. 0 days | 91.8% | (± 4.1%) | 91.5% | (± 1.2%) |
| b. 1–2 days | 2.9 | (± 2.5) | 4.3 | (± 0.8) |
| c. 3–9 days | 3.5 | (± 2.8) | 2.3 | (± 0.6) |
| d. 10–29 days | 1.2 | (± 1.6) | 0.9 | (± 0.3) |
| e. All 30 days | 0.6 | (± 1.2) | 1.0 | (± 0.3) |
| Any use in past 30 days | 8.2 | (± 4.1) | 8.5 | (± 1.2) |
| 27. Use tobacco that tastes like candy, fruit, or alcohol (tobacco includes: little cigars, bidis, cloves, chew, spit, snus, hookah)? | Local
(n = 169) | State
(n = 3,590) |
| a. 0 days | 85.8% | (± 5.3%) | 89.5% | (± 1.2%) |
| b. 1–2 days | 3.0 | (± 2.5) | 5.5 | (± 0.7) |
| c. 3–9 days | 7.1 | (± 3.9) | 3.0 | (± 0.6) |
| d. 10–29 days | 3.6 | (± 2.8) | 1.2 | (± 0.4) |
| e. All 30 days | 0.6 | (± 1.2) | 0.8 | (± 0.3) |
| Any use in past 30 days | 14.2 | (± 5.3) | 10.5 | (± 1.2) |
| 28. Drink a glass, can or bottle of alcohol (beer, wine, wine coolers, hard liquor)? | Local
(n = 338) | State
(n = 7,135) |
| a. None | 74.0% | (± 4.7%) | 72.5% | (± 1.8%) |
| b. 1–2 days | 17.8 | (± 4.1) | 16.7 | (± 1.0) |
| c. 3–5 days | 4.7 | (± 2.3) | 6.0 | (± 0.8) |
| d. 6–9 days | 2.7 | (± 1.7) | 2.4 | (± 0.4) |
| e. 10 or more days | 0.9 | (± 1.0) | 2.3 | (± 0.5) |
| Any use in past 30 days | 26.0 | (± 4.7) | 27.5 | (± 1.8) |
| 29. Use marijuana or hashish (grass, hash, pot)? | Local
(n = 338) | State
(n = 7,134) |
| a. None | 76.6% | (± 4.5%) | 80.1% | (± 1.7%) |
| b. 1–2 days | 7.1 | (± 2.7) | 7.3 | (± 0.7) |
| c. 3–5 days | 3.9 | (± 2.1) | 4.1 | (± 0.7) |
| d. 6–9 days | 2.1 | (± 1.5) | 2.2 | (± 0.4) |
| e. 10 or more days | 10.4 | (± 3.3) | 6.2 | (± 0.8) |
| Any use in past 30 days | 23.4 | (± 4.5) | 19.9 | (± 1.7) |
| 30. Not counting alcohol, tobacco, or marijuana, use another illegal drug? | Local
(n = 337) | State
(n = 7,136) |
| a. None | 92.3% | (± 2.8%) | 93.5% | (± 1.1%) |
| b. 1–2 days | 4.8 | (± 2.3) | 3.4 | (± 0.5) |
| c. 3–5 days | 1.5 | (± 1.3) | 1.5 | (± 0.4) |
| d. 6–9 days | 0.3 | (± 0.6) | 0.8 | (± 0.3) |
| e. 10 or more days | 1.2 | (± 1.2) | 0.8 | (± 0.2) |
| Any use in past 30 days | 7.7 | (± 2.8) | 6.5 | (± 1.1) |
| 31. Use any illegal drug, including marijuana? (Computed from items 29 and 30.) | Local
(n = 337) | State
(n = 7,126) |
| None | 75.1% | (± 4.6%) | 79.3% | (± 1.7%) |
| 1 or more | 24.9 | (± 4.6) | 20.8 | (± 1.7) |
| Any use in the past 30 days | 24.9 | (± 4.6) | 20.8 | (± 1.7) |
| 32. Use a pain killer to get high, like Vicodin, OxyContin (sometimes called Oxy or OC) or Percocet (sometimes called Percs)? | Local
(n = 337) | State
(n = 7,119) |
| a. None | 89.9% | (± 3.2%) | 91.8% | (± 1.2%) |
| b. 1–2 days | 4.5 | (± 2.2) | 4.3 | (± 0.6) |
| c. 3–5 days | 3.6 | (± 2.0) | 2.1 | (± 0.5) |
| d. 6–9 days | 0.9 | (± 1.0) | 0.8 | (± 0.2) |
| e. 10 or more days | 1.2 | (± 1.2) | 1.0 | (± 0.3) |
| Any use in past 30 days | 10.1 | (± 3.2) | 8.2 | (± 1.2) |
| 33. Some kids take a medicine prescribed by their doctor to help with hyperactivity or focus (ADD). Some names for this medicine are Ritalin, Adderall, or Concerta. In the past 30 days have you taken one of these drugs? | Local
(n = 166) | State
(n = 3,524) |
| a. No | 89.2% | (± 4.7%) | 88.6% | (± 1.4%) |
| b. Yes—prescribed by my doctor for me | 7.8 | (± 4.1) | 7.8 | (± 0.9) |
| c. Yes—but NOT prescribed by a doctor for me | 3.0 | (± 2.6) | 3.6 | (± 0.8) |
Other Tobacco-Related Questions
| 34. If one of your best friends offered you a cigarette, would you smoke it? | Local
(n = 336) | State
(n = 7,063) |
| a. Definitely no | 72.6% | (± 4.8%) | 72.3% | (± 2.2%) |
| b. Probably no | 11.6 | (± 3.4) | 13.2 | (± 1.0) |
| c. Probably yes | 8.3 | (± 3.0) | 8.6 | (± 1.0) |
| d. Definitely yes | 7.4 | (± 2.8) | 5.8 | (± 1.0) |
| 35. Do you think that you will smoke a cigarette anytime in the next year? | Local
(n = 336) | State
(n = 7,062) |
| a. Definitely no | 69.4% | (± 4.9%) | 70.0% | (± 2.3%) |
| b. Probably no | 13.1 | (± 3.6) | 14.3 | (± 1.1) |
| c. Probably yes | 11.6 | (± 3.4) | 9.2 | (± 1.0) |
| d. Definitely yes | 6.0 | (± 2.5) | 6.6 | (± 1.1) |
| 36. Have made a firm commitment to not smoke cigarettes; i.e., not susceptible to smoking. (Computed from both items 34 and 35). | Local
(n = 336) | State
(n = 7,068) |
| a. Yes, not susceptible | 67.0% | (± 5.0%) | 67.1% | (± 2.4%) |
| b. No, susceptible | 33.0 | (± 5.0) | 32.9 | (± 2.4) |
| 37. Do you think young people risk harming themselves if they smoke 1–5 cigarettes a day? | Local
(n = 170) | State
(n = 3,589) |
| a. Definitely no | 4.1% | (± 3.0%) | 5.7% | (± 1.1%) |
| b. Probably no | 1.8 | (± 2.0) | 3.3 | (± 0.6) |
| c. Probably yes | 14.7 | (± 5.3) | 19.6 | (± 1.8) |
| d. Definitely yes | 79.4 | (± 6.1) | 71.3 | (± 2.8) |
| 38. During the past year in school, how many times did you get information in classes about the dangers of tobacco use? | Local
(n = 170) | State
(n = 3,579) |
| a. None | 28.8% | (± 6.8%) | 37.9% | (± 3.9%) |
| b. Once | 20.6 | (± 6.1) | 24.4 | (± 1.4) |
| c. 2 or 3 times | 27.7 | (± 6.7) | 24.6 | (± 2.1) |
| d. 4 or more times | 22.9 | (± 6.3) | 13.1 | (± 2.1) |
| 39. Do you think that rules about not using tobacco at your school are usually enforced? | Local
(n = 168) | State
(n = 3,568) |
| a. Definitely no | 9.5% | (± 4.4%) | 14.4% | (± 2.1%) |
| b. Probably no | 16.1 | (± 5.5) | 18.1 | (± 1.7) |
| c. Probably yes | 43.5 | (± 7.5) | 42.7 | (± 2.1) |
| d. Definitely yes | 31.0 | (± 7.0) | 24.9 | (± 2.6) |
| 40. During the past 30 days, on how many days did you use tobacco (cigarettes, cigars, or chew/dip) on school property? | Local
(n = 168) | State
(n = 3,579) |
| a. 0 days | 93.5% | (± 3.7%) | 93.9% | (± 1.4%) |
| b. 1–2 days | 4.2 | (± 3.0) | 2.4 | (± 0.6) |
| c. 3–9 days | 2.4 | (± 2.3) | 1.3 | (± 0.5) |
| d. 10–29 days | 0.0 | (± 0.0) | 1.2 | (± 0.4) |
| e. All 30 days | 0.0 | (± 0.0) | 1.2 | (± 0.5) |
| 41. Do you think the smoke from other people’s cigarettes (secondhand smoke) is harmful to you? | Local
(n = 163) | State
(n = 3,337) |
| a. Definitely no | 2.5% | (± 2.4%) | 9.2% | (± 2.0%) |
| b. Probably no | 5.5 | (± 3.5) | 6.3 | (± 1.4) |
| c. Probably yes | 24.5 | (± 6.6) | 26.2 | (± 1.9) |
| d. Definitely yes | 67.5 | (± 7.2) | 58.3 | (± 3.0) |
| 42. Some tobacco companies make t-shirts, lighters, or other items that people can buy or receive for free. During the past 12 months, did you buy or receive anything that has a tobacco company name or picture on it? | Local
(n = 162) | State
(n = 3,332) |
| a. No | 87.0% | (± 5.2%) | 89.8% | (± 1.5%) |
| b. Yes | 13.0 | (± 5.2) | 10.2 | (± 1.5) |
| 43. During the past 7 days, on how many days were you in the same room with someone who was smoking cigarettes? | Local
(n = 162) | State
(n = 3,320) |
| a. 0 days | 59.3% | (± 7.6%) | 64.9% | (± 2.8%) |
| b. 1–2 days | 22.2 | (± 6.4) | 17.8 | (± 1.5) |
| c. 3–4 days | 8.0 | (± 4.2) | 6.8 | (± 1.1) |
| d. 5–6 days | 6.2 | (± 3.7) | 3.3 | (± 0.6) |
| e. 7 days | 4.3 | (± 3.1) | 7.3 | (± 1.4) |
| 44. Does anyone who lives with you now smoke cigarettes? | Local
(n = 162) | State
(n = 3,300) |
| a. No | 64.2% | (± 7.4%) | 71.0% | (± 2.8%) |
| b. Yes | 35.8 | (± 7.4) | 29.0 | (± 2.8) |
| 45. During the past 7 days, on how many days did you ride in a car with someone who was smoking cigarettes? | Local
(n = 163) | State
(n = 3,319) |
| a. 0 days | 72.4% | (± 6.9%) | 74.5% | (± 2.9%) |
| b. 1-2 days | 10.4 | (± 4.7) | 12.4 | (± 1.7) |
| c. 3-4 days | 8.6 | (± 4.3) | 5.5 | (± 0.9) |
| d. 5-6 days | 4.3 | (± 3.1) | 3.6 | (± 0.8) |
| e. 7 days | 4.3 | (± 3.1) | 4.1 | (± 0.8) |
| 46. Has either of your parents (or guardians) discussed the dangers of tobacco use with you? | Local
(n = 160) | State
(n = 3,293) |
| a. Mother (or female guardian) only | 16.3% | (± 5.7%) | 16.3% | (± 1.6%) |
| b. Father (or male guardian) only | 6.9 | (± 3.9) | 5.7 | (± 1.3) |
| c. Both | 48.1 | (± 7.7) | 50.5 | (± 2.6) |
| d. Neither | 28.8 | (± 7.0) | 27.5 | (± 1.8) |
| 47. Which of these best describes the rules about smoking inside the house where you live? Smoking is… | Local
(n = 162) | State
(n = 3,311) |
| a. Never allowed inside my house | 84.6% | (± 5.6%) | 84.9% | (± 2.2%) |
| b. Allowed only at some times or in some places | 12.4 | (± 5.1) | 10.8 | (± 1.6) |
| c. Always allowed inside my house | 3.1 | (± 2.7) | 4.3 | (± 0.9) |
| 48. During the past 30 days, have you seen or heard commercials on TV, the Internet, or on the radio about the dangers of cigarette smoking? | Local
(n = 162) | State
(n = 3,303) |
| a. Not in the past 30 days | 39.5% | (± 7.5%) | 34.6% | (± 2.4%) |
| b. 1–3 times in the past 30 days | 25.9 | (± 6.7) | 29.9 | (± 1.7) |
| c. 1–3 times per week | 17.9 | (± 5.9) | 16.8 | (± 1.3) |
| d. Daily or almost daily | 12.4 | (± 5.1) | 12.0 | (± 1.1) |
| e. More than once a day | 4.3 | (± 3.1) | 6.7 | (± 0.9) |
| 49. During the past 30 days, how did you usually get your own tobacco? (Choose only one answer.) | Local
(n = 158) | State
(n = 3,274) |
| a. I did not use tobacco during the past 30 days | 83.5% | (± 5.8%) | 85.3% | (± 2.2%) |
| b. I bought it in a store such as a convenience store, supermarket, discount store or gas station | 1.3 | (± 1.7) | 1.7 | (± 0.7) |
| c. I bought it from a vending machine | 0.6 | (± 1.2) | 0.9 | (± 0.4) |
| d. I gave someone else money to buy them for me | 7.0 | (± 4.0) | 4.3 | (± 0.7) |
| e. I borrowed (or bummed) them from someone else | 1.9 | (± 2.1) | 2.8 | (± 0.6) |
| f. A person 18 years old or older gave them to me | 2.5 | (± 2.5) | 2.0 | (± 0.6) |
| g. I took them from a store or a family member | 1.3 | (± 1.7) | 0.8 | (± 0.3) |
| h. I got them some other way | 1.9 | (± 2.1) | 2.4 | (± 0.8) |
Other Alcohol- and Drug-Related Questions
| 50. During the past 30 days, have you seen or heard advertisements on TV, the Internet, the radio, or magazines about the dangers of kids drinking alcohol? | Local
(n = 172) | State
(n = 3,584) |
| a. Not in the past 30 days | 31.4% | (± 6.9%) | 30.0% | (± 1.5%) |
| b. 1–3 times in the past 30 days | 32.6 | (± 7.0) | 32.6 | (± 1.9) |
| c. 1–3 times per week | 16.3 | (± 5.5) | 18.1 | (± 0.9) |
| d. Daily or almost daily | 13.4 | (± 5.1) | 12.6 | (± 1.1) |
| e. More than once a day | 6.4 | (± 3.7) | 6.7 | (± 0.9) |
| 51. NOT including talks on drinking and driving, in the past year have your parents or guardians talked to you about why you should not drink alcohol? | Local
(n = 173) | State
(n = 3,577) |
| a. Yes, a number of times | 36.4% | (± 7.2%) | 36.2% | (± 2.1%) |
| b. Yes, once | 20.8 | (± 6.1) | 18.6 | (± 1.6) |
| c. No | 27.8 | (± 6.7) | 30.9 | (± 1.3) |
| d. I don’t remember | 15.0 | (± 5.3) | 14.3 | (± 1.1) |
| 52. During the past year in school, how many times did you get information in classes about reasons not to use alcohol and other drugs? | Local
(n = 173) | State
(n = 3,563) |
| a. None | 15.0% | (± 5.3%) | 24.7% | (± 2.6%) |
| b. Once | 30.6 | (± 6.9) | 29.8 | (± 1.8) |
| c. 2 or 3 times | 33.5 | (± 7.0) | 29.4 | (± 2.2) |
| d. 4 or more times | 20.8 | (± 6.1) | 16.1 | (± 2.3) |
| 53. Do you think that rules about not drinking alcohol or using drugs at your school are usually enforced? | Local
(n = 167) | State
(n = 3,563) |
| a. Definitely no | 9.6% | (± 4.5%) | 11.2% | (± 1.3%) |
| b. Probably no | 11.4 | (± 4.8) | 13.8 | (± 1.5) |
| c. Probably yes | 45.5 | (± 7.5) | 41.2 | (± 2.4) |
| d. Definitely yes | 33.5 | (± 7.2) | 33.8 | (± 2.4) |
| 54. How much do you think people risk harming themselves if they smoke marijuana occasionally? | Local
(n = 173) | State
(n = 3,561) |
| a. No risk | 19.7% | (± 5.9%) | 18.4% | (± 1.9%) |
| b. Slight risk | 19.1 | (± 5.9) | 20.1 | (± 1.5) |
| c. Moderate risk | 26.6 | (± 6.6) | 30.1 | (± 1.8) |
| d. Great risk | 33.0 | (± 7.0) | 27.9 | (± 1.9) |
| e. Not sure | 1.7 | (± 1.9) | 3.5 | (± 0.9) |
| 55. Think back over the last 2 weeks. How many times have you had five or more drinks in a row? (A drink is a glass of wine, a bottle of beer, a shot glass of liquor, or a mixed drink.) | Local
(n = 335) | State
(n = 7,079) |
| a. None | 85.1% | (± 3.8%) | 84.1% | (± 1.8%) |
| b. Once | 6.0 | (± 2.5) | 6.9 | (± 0.7) |
| c. Twice | 3.9 | (± 2.1) | 4.3 | (± 0.6) |
| d. 3–5 times | 3.6 | (± 2.0) | 2.5 | (± 0.5) |
| e. 6–9 times | 0.6 | (± 0.8) | 1.1 | (± 0.3) |
| f. 10 or more times | 0.9 | (± 1.0) | 1.1 | (± 0.3) |
| 56. If you had to guess, how many students in your grade at school drank alcohol during the past 30 days? | Local
(n = 170) | State
(n = 3,533) |
| a. 0 out of 10 (none) | 2.4% | (± 2.3%) | 3.3% | (± 0.9%) |
| b. 1 out of 10 | 4.1 | (± 3.0) | 7.5 | (± 1.4) |
| c. 2 out of 10 | 5.9 | (± 3.5) | 8.3 | (± 1.0) |
| d. 3 out of 10 | 13.5 | (± 5.1) | 13.4 | (± 1.5) |
| e. 4 out of 10 | 15.9 | (± 5.5) | 12.6 | (± 1.2) |
| f. 5 out of 10 (about half) | 24.7 | (± 6.5) | 20.9 | (± 1.5) |
| g. 6 out of 10 | 9.4 | (± 4.4) | 8.9 | (± 1.0) |
| h. 7 out of 10 | 11.2 | (± 4.7) | 9.9 | (± 1.3) |
| i. 8 out of 10 | 8.8 | (± 4.3) | 7.3 | (± 1.2) |
| j. 9 out of 10 | 2.9 | (± 2.5) | 3.8 | (± 0.6) |
| k. 10 out of 10 (all) | 1.2 | (± 1.6) | 4.2 | (± 1.2) |
| 57. Think about the students in your school. If you had to guess, how wrong do most students in your grade think it is to drink alcohol regularly? | Local
(n = 163) | State
(n = 3,394) |
| a. Very wrong | 14.7% | (± 5.4%) | 17.2% | (± 2.0%) |
| b. Wrong | 27.0 | (± 6.8) | 25.0 | (± 2.0) |
| c. A little bit wrong | 43.6 | (± 7.6) | 39.3 | (± 1.9) |
| d. Not wrong at all | 14.7 | (± 5.4) | 18.4 | (± 1.7) |
| 58. Drinking Categories Variable (Computed from items 28 and 55). | Local
(n = 335) | State
(n = 7,082) |
| a. No alcohol use | 73.1% | (± 4.7%) | 70.7% | (± 2.1%) |
| b. 1-2 days and no binges | 10.8 | (± 3.3) | 11.0 | (± 0.6) |
| c. 3-5 days or 1 binge | 6.6 | (± 2.6) | 8.1 | (± 0.7) |
| d. 6+ days or 2+ binges | 9.6 | (± 3.2) | 10.2 | (± 1.5) |
| 59. How many times in the past year (12 months) have you been drunk or high at school? | Local
(n = 336) | State
(n = 7,067) |
| a. Never | 79.8% | (± 4.3%) | 83.4% | (± 1.8%) |
| b. 1–2 times | 7.1 | (± 2.8) | 7.4 | (± 0.8) |
| c. 3–5 times | 4.5 | (± 2.2) | 3.4 | (± 0.6) |
| d. 6–9 times | 1.8 | (± 1.4) | 1.6 | (± 0.4) |
| e. 10 or more times | 6.9 | (± 2.7) | 4.2 | (± 0.7) |
| 60. During the past 30 days, how did you usually get alcohol (beer, wine, or hard liquor)? Choose all that apply.
Percentages do not total 100% due to multiple responses. | Local
(n = 166) | State
(n = 3,475) |
| a. I did not get alcohol in the past 30 days | 79.5% | (± 6.1%) | 72.9% | (± 2.1%) |
| b. I bought it from a store | 1.2 | (± 1.7) | 2.1 | (± 0.5) |
| c. I got it from friends | 7.2 | (± 3.9) | 9.8 | (± 1.3) |
| d. I got it at a party | 6.6 | (± 3.8) | 8.9 | (± 1.1) |
| e. I got it from an older brother or sister | 2.4 | (± 2.3) | 2.0 | (± 0.5) |
| f. I gave money to someone to get it for me | 6.0 | (± 3.6) | 4.9 | (± 0.9) |
| g. I took it from home without my parents’ permission | 3.0 | (± 2.6) | 4.4 | (± 0.8) |
| h. I got it at home with my parents’ permission | 1.8 | (± 2.0) | 4.0 | (± 0.6) |
| i. I got it at a family celebration, ceremony, or party | 3.6 | (± 2.8) | 2.9 | (± 0.6) |
| j. I got it some other way | 3.0 | (± 2.6) | 4.0 | (± 0.8) |
| 61. If you have EVER used pain killers to get high, where did you usually get them? | Local
(n = 163) | State
(n = 3,494) |
| a. I did not use pain killers to get high | 87.1% | (± 5.1%) | 85.2% | (± 1.7%) |
| b. I used my own prescriptions (from a doctor or dentist) | 1.2 | (± 1.7) | 4.4 | (± 0.7) |
| c. A family member gave them to me | 0.6 | (± 1.2) | 1.1 | (± 0.5) |
| d. I took them from my home or someone else’s home without permission | 1.8 | (± 2.1) | 2.4 | (± 0.5) |
| e. I got them from a friend | 4.3 | (± 3.1) | 4.3 | (± 0.5) |
| f. I got them from an acquaintance | 2.5 | (± 2.4) | 0.7 | (± 0.3) |
| g. I got them from a drug dealer | 2.5 | (± 2.4) | 1.1 | (± 0.4) |
| h. I got them from the internet | 0.0 | (± 0.0) | 0.1 | (± 0.1) |
| i. I got them some other way | 0.0 | (± 0.0) | 0.9 | (± 0.3) |
| 62. During the last year, have you felt that you needed help (such as counseling or treatment) for your alcohol, tobacco, or other drug use? | Local
(n = 165) | State
(n = 3,512) |
| a. I have not used alcohol or other drugs | 66.7% | (± 7.2%) | 67.1% | (± 2.3%) |
| b. I have used alcohol and/or drugs but I haven’t needed help | 26.7 | (± 6.7) | 25.9 | (± 1.9) |
| c. Yes, I felt I have needed help | 3.0 | (± 2.6) | 2.7 | (± 0.5) |
| d. Not sure | 3.6 | (± 2.9) | 4.4 | (± 0.9) |
Other Health Concerns
This section provides results regarding other health concerns including nutrition and fitness, health conditions and health care, safety, behaviors related to intentional injury, depression, and gambling behavior. Proper nutrition and exercise are critical components of a healthy life, as is access to preventive health care. Safety-related behaviors, such as wearing a seat belt when in a moving vehicle, can profoundly influence the outcome of an accident. Injury is the leading cause of death for adolescents aged 10 to 19, and violence contributes to injury-related deaths. People who are depressed experience a range of symptoms, and depression is associated with suicidal behavior.
Nutrition and Fitness
| 63. Obese: “Obese” includes students who are in the top 5% for body mass index by age and gender based on growth charts developed by the Centers for Disease Control and Prevention (2000). “Overweight” includes students who are in the top 15% but not the top 5%. (Computed from numeric responses to “How tall are you without your shoes on?” and “How much do you weigh without your shoes on?”) | Local
(n = *) | State
(n = 3,306) |
| Obese | *.*% | (± *.*%) | 9.5% | (± 1.5%) |
| Overweight | *.* | (± *.*) | 14.3 | (± 1.5) |
| Not overweight | *.* | (± *.*) | 76.2 | (± 2.3) |
| 64. Which of the following are you trying to do about your weight? | Local
(n = 170) | State
(n = 3,525) |
| a. I am not trying to do anything about my weight | 29.4% | (± 6.8%) | 27.8% | (± 1.9%) |
| b. Lose weight | 37.7 | (± 7.3) | 42.2 | (± 1.6) |
| c. Gain weight | 11.8 | (± 4.8) | 12.6 | (± 0.7) |
| d. Stay the same weight | 21.2 | (± 6.1) | 17.4 | (± 1.1) |
| 65. How often do you eat dinner with your family? | Local
(n = 168) | State
(n = 3,560) |
| a. Never | 6.0% | (± 3.6%) | 7.1% | (± 1.1%) |
| b. Rarely | 14.3 | (± 5.3) | 13.8 | (± 1.2) |
| c. Sometimes | 26.2 | (± 6.6) | 19.4 | (± 1.5) |
| d. Most of the time | 33.9 | (± 7.2) | 34.1 | (± 2.0) |
| e. Always | 19.6 | (± 6.0) | 25.6 | (± 1.4) |
| 66. How often in the past 12 months did you or your family have to cut meal size or skip meals because there wasn’t enough money for food?† | Local
(n = 154) | State
(n = 2,627) |
| a. Almost every month | 3.9% | (± 3.1%) | 7.2% | (± 1.8%) |
| b. Some months but not every month | 8.4 | (± 4.4) | 6.6 | (± 1.4) |
| c. Only 1–2 months | 7.8 | (± 4.2) | 5.7 | (± 1.5) |
| d. Did not have to skip or cut the size of meals | 79.9 | (± 6.3) | 80.6 | (± 3.9) |
| 67. Did you eat breakfast today? | Local
(n = 169) | State
(n = 3,563) |
| a. Yes | 61.0% | (± 7.4%) | 63.4% | (± 2.8%) |
| b. No | 39.1 | (± 7.4) | 36.7 | (± 2.8) |
| 68. How many sodas or pops did you drink yesterday? (Do not count diet soda.) | Local
(n = 168) | State
(n = 3,565) |
| a. None | 66.1% | (± 7.2%) | 64.2% | (± 2.8%) |
| b. 1 | 19.1 | (± 5.9) | 23.8 | (± 2.0) |
| c. 2 | 11.3 | (± 4.8) | 7.5 | (± 1.0) |
| d. 3 | 1.2 | (± 1.6) | 2.8 | (± 0.6) |
| e. 4 or more | 2.4 | (± 2.3) | 1.7 | (± 0.5) |
| 69. During the past 7 days, how many times did you drink regular soda, sports drinks (such as Gatorade) and other flavored sweetened drinks (such as Snapple or SoBe) at school (including any after-school and weekend activities)? Do not include diet drinks. | Local
(n = 168) | State
(n = 3,563) |
| a. 0 times | 27.4% | (± 6.7%) | 29.2% | (± 2.7%) |
| b. 1–3 times | 41.7 | (± 7.4) | 39.7 | (± 2.0) |
| c. 4–6 times | 17.3 | (± 5.7) | 16.1 | (± 1.3) |
| d. 7–9 times | 4.2 | (± 3.0) | 6.0 | (± 1.0) |
| e. 10 times or more | 9.5 | (± 4.4) | 9.0 | (± 1.4) |
| 70. During the past 7 days, where did you usually get the soda or other sweetened drinks that you drank at school? (Choose only one answer.) | Local
(n = 168) | State
(n = 3,540) |
| a. I did not drink sodas, sports drinks, or other flavored drinks at school | 39.9% | (± 7.4%) | 34.2% | (± 2.8%) |
| b. I brought them from home | 41.1 | (± 7.4) | 24.8 | (± 1.8) |
| c. I got them from friends | 8.9 | (± 4.3) | 5.7 | (± 0.8) |
| d. I bought them at school | 3.6 | (± 2.8) | 24.4 | (± 3.1) |
| e. Other | 6.6 | (± 3.7) | 10.9 | (± 1.6) |
On how many of the past 7 days did you:
| 71. In the past 7 days, on how many days were you physically active for a total of at least 60 minutes per day? (Add up all the time you spent in any kind of physical activity that increases your heart rate or makes you breathe hard some of the time.) | Local
(n = 166) | State
(n = 3,552) |
| a. 0 days | 17.5% | (± 5.8%) | 13.0% | (± 1.6%) |
| b. 1 day | 7.2 | (± 3.9) | 7.1 | (± 1.0) |
| c. 2 days | 7.8 | (± 4.1) | 8.9 | (± 1.1) |
| d. 3 days | 12.1 | (± 5.0) | 10.1 | (± 1.4) |
| e. 4 days | 10.8 | (± 4.7) | 9.4 | (± 1.2) |
| f. 5 days | 15.7 | (± 5.5) | 18.2 | (± 1.8) |
| g. 6 days | 6.0 | (± 3.6) | 11.4 | (± 1.7) |
| h. 7 days | 22.9 | (± 6.4) | 21.9 | (± 2.3) |
| 72. On average how many days a week do you walk to or from school? | Local
(n = 168) | State
(n = 3,548) |
| a. Never | 61.3% | (± 7.4%) | 63.2% | (± 5.2%) |
| b. 1–2 | 11.3 | (± 4.8) | 14.0 | (± 2.0) |
| c. 3–4 | 6.6 | (± 3.7) | 6.2 | (± 1.2) |
| d. I walk every day | 20.8 | (± 6.1) | 16.6 | (± 2.9) |
| 73. On average how many days a week do you ride a bicycle to or from school? | Local
(n = 168) | State
(n = 3,549) |
| a. Never | 95.8% | (± 3.0%) | 93.8% | (± 1.4%) |
| b. 1–2 | 1.2 | (± 1.6) | 3.3 | (± 0.7) |
| c. 3–4 | 0.0 | (± 0.0) | 1.5 | (± 0.5) |
| d. I bike every day | 3.0 | (± 2.6) | 1.4 | (± 0.5) |
| 74. On an average school day, how many hours do you watch TV, including videos and DVDs? | Local
(n = 166) | State
(n = 3,553) |
| a. I do not watch TV on an average school day | 16.3% | (± 5.6%) | 13.5% | (± 1.7%) |
| b. Less than 1 hour per day | 15.7 | (± 5.5) | 21.0 | (± 1.7) |
| c. 1 hour per day | 18.7 | (± 5.9) | 17.5 | (± 1.3) |
| d. 2 hours per day | 25.9 | (± 6.7) | 23.4 | (± 1.7) |
| e. 3 hours per day | 9.6 | (± 4.5) | 12.7 | (± 1.5) |
| f. 4 hours per day | 7.2 | (± 3.9) | 6.3 | (± 1.0) |
| g. 5 or more hours per day | 6.6 | (± 3.8) | 5.5 | (± 1.0) |
| 75. On an average school day, how many hours do you play video games or use a computer for fun? (Include activities such as Nintendo, Game Boy, Play Station, computer games, and the Internet.) | Local
(n = 167) | State
(n = 3,552) |
| a. I do not play video games or use a computer for fun on an average school day | 16.8% | (± 5.7%) | 20.7% | (± 2.0%) |
| b. Less than 1 hour per day | 20.4 | (± 6.1) | 24.5 | (± 1.9) |
| c. 1 hour per day | 19.2 | (± 6.0) | 17.6 | (± 1.6) |
| d. 2 hours per day | 18.0 | (± 5.8) | 15.3 | (± 1.6) |
| e. 3 hours per day | 7.2 | (± 3.9) | 10.3 | (± 1.0) |
| f. 4 hours per day | 6.6 | (± 3.8) | 4.8 | (± 0.7) |
| g. 5 or more hours per day | 12.0 | (± 4.9) | 6.7 | (± 0.8) |
| 76. In an average week when you are in school, on how many days do you go to physical education (PE) classes? | Local
(n = 167) | State
(n = 3,547) |
| a. 0 days | 64.7% | (± 7.3%) | 57.4% | (± 6.0%) |
| b. 1 day | 1.2 | (± 1.6) | 1.1 | (± 0.5) |
| c. 2 days | 1.2 | (± 1.6) | 1.4 | (± 0.6) |
| d. 3 days | 1.8 | (± 2.0) | 6.7 | (± 3.7) |
| e. 4 days | 0.6 | (± 1.2) | 3.4 | (± 2.7) |
| f. 5 days | 30.5 | (± 7.0) | 30.0 | (± 6.8) |
| 77. During an average PE class, how many minutes do you spend actually exercising or playing sports? | Local
(n = 167) | State
(n = 3,537) |
| a. I do not take PE | 55.7% | (± 7.5%) | 51.5% | (± 5.6%) |
| b. Less than 10 minutes | 1.8 | (± 2.0) | 1.4 | (± 0.5) |
| c. 10–20 minutes | 3.6 | (± 2.8) | 3.1 | (± 0.9) |
| d. 21–30 minutes | 5.4 | (± 3.4) | 4.8 | (± 1.0) |
| e. 31–40 minutes | 15.0 | (± 5.4) | 10.7 | (± 2.1) |
| f. 41–50 minutes | 12.0 | (± 4.9) | 13.0 | (± 2.8) |
| g. 51–60 minutes | 4.8 | (± 3.2) | 8.1 | (± 1.7) |
| h. More than 60 minutes | 1.8 | (± 2.0) | 7.5 | (± 2.7) |
| 78. During the average week, on how many days do you participate in supervised after-school activities either at school or away from school? Include activities such as sports, art, music, dance, drama, or community service, religious, or club activities. | Local
(n = 340) | State
(n = 7,011) |
| a. 0 days | 34.7% | (± 5.1%) | 31.2% | (± 2.3%) |
| b. 1–2 days | 19.4 | (± 4.2) | 22.7 | (± 1.6) |
| c. 3 or more days | 45.9 | (± 5.3) | 46.1 | (± 2.2) |
Health Conditions and Health Care
| 79. Has a doctor or nurse ever told you that you have asthma? | Local
(n = 166) | State
(n = 3,527) |
| a. Yes | 19.3% | (± 6.0%) | 19.5% | (± 1.5%) |
| b. No | 76.5 | (± 6.4) | 74.8 | (± 1.6) |
| c. Not sure | 4.2 | (± 3.1) | 5.7 | (± 0.6) |
| 80. Do you still have asthma? | Local
(n = 166) | State
(n = 3,519) |
| a. I have never had asthma | 69.3% | (± 7.0%) | 63.8% | (± 1.9%) |
| b. Yes | 9.6 | (± 4.5) | 13.0 | (± 1.4) |
| c. No | 13.9 | (± 5.3) | 13.8 | (± 1.0) |
| d. Not sure | 7.2 | (± 3.9) | 9.4 | (± 1.0) |
| 81. RESCUE inhalers are asthma medicine that you breath in through your mouth that gives you QUICK relief from asthma symptoms. They are PRESCRIBED by a doctor. During the past 4 weeks, about how many days per week on average did you use a rescue inhaler?† | Local
(n = 156) | State
(n = 2,558) |
| a. Never | 93.0% | (± 4.0%) | 89.7% | (± 2.5%) |
| b. 1 or 2 days per week | 1.9 | (± 2.2) | 5.1 | (± 1.0) |
| c. 3 to 6 days per week | 3.2 | (± 2.8) | 1.5 | (± 0.7) |
| d. Every day, once per day | 0.0 | (± 0.0) | 1.1 | (± 0.5) |
| e. Every day, twice or more per day | 0.0 | (± 0.0) | 0.9 | (± 0.5) |
| f. I’m not sure | 1.9 | (± 2.2) | 1.6 | (± 0.6) |
| 82. During the past 12 months, how many times did you visit an emergency room or urgent care center because of your asthma?† | Local
(n = 156) | State
(n = 2,568) |
| a. I do not have asthma | 81.4% | (± 6.1%) | 77.6% | (± 2.5%) |
| b. None | 16.7 | (± 5.8) | 17.6 | (± 2.1) |
| c. 1 to 3 times | 1.3 | (± 1.8) | 2.7 | (± 1.1) |
| d. 4 to 9 times | 0.6 | (± 1.3) | 0.9 | (± 0.4) |
| e. 10 to 12 times | 0.0 | (± 0.0) | 0.2 | (± 0.2) |
| f. More than 12 times | 0.0 | (± 0.0) | 0.2 | (± 0.2) |
| g. I don’t know | 0.0 | (± 0.0) | 0.9 | (± 0.5) |
| 83. During the past 12 months, how many days did you stay out of school or stay away from your usual activities because of your asthma?† | Local
(n = 157) | State
(n = 2,555) |
| a. I do not have asthma | 82.2% | (± 6.0%) | 78.7% | (± 2.8%) |
| b. None | 15.3 | (± 5.6) | 16.0 | (± 1.7) |
| c. 1 to 2 days | 0.6 | (± 1.2) | 2.6 | (± 1.0) |
| d. 3 to 4 days | 0.6 | (± 1.2) | 1.1 | (± 0.8) |
| e. 5 to 10 days | 0.6 | (± 1.2) | 0.5 | (± 0.4) |
| f. More than 10 days | 0.0 | (± 0.0) | 0.4 | (± 0.3) |
| g. I don’t know | 0.6 | (± 1.2) | 0.7 | (± 0.3) |
| 84. Symptoms of asthma include coughing, wheezing, shortness of breath, and chest tightness when you don't have a cold or the flu. During the past 4 weeks, about how many days per week on average did you have any symptoms of asthma?† | Local
(n = 156) | State
(n = 2,547) |
| a. Never | 82.1% | (± 6.0%) | 78.5% | (± 1.8%) |
| b. 1 or 2 days per week | 8.3 | (± 4.3) | 11.5 | (± 1.1) |
| c. 3 to 6 days per week | 4.5 | (± 3.3) | 4.0 | (± 1.0) |
| d. Every day, but not throughout the day | 2.6 | (± 2.5) | 1.7 | (± 0.5) |
| e. Every day, throughout the day | 0.0 | (± 0.0) | 1.1 | (± 0.4) |
| f. I’m not sure | 2.6 | (± 2.5) | 3.2 | (± 0.7) |
| 86. Have you ever been told by a doctor or other health professional that you have diabetes? | Local
(n = 160) | State
(n = 3,302) |
| a. No | 93.1% | (± 3.9%) | 93.6% | (± 1.5%) |
| b. Yes | 1.3 | (± 1.7) | 4.2 | (± 1.2) |
| c. I don’t know | 5.6 | (± 3.6) | 2.2 | (± 0.6) |
| 87. When was the last time you saw a doctor or health care provider for a check-up or physical exam when you were not sick or injured? | Local
(n = 165) | State
(n = 3,520) |
| a. During the past 12 months | 54.6% | (± 7.6%) | 60.6% | (± 2.9%) |
| b. Between 12 and 24 months ago | 17.6 | (± 5.8) | 17.0 | (± 1.7) |
| c. More than 24 months ago | 11.5 | (± 4.9) | 6.7 | (± 1.3) |
| d. Never | 3.0 | (± 2.6) | 4.0 | (± 0.7) |
| e. Not sure | 13.3 | (± 5.2) | 11.8 | (± 1.4) |
| 88. When was the last time you saw a dentist for a check-up, exam, teeth cleaning, or other dental work? | Local
(n = 167) | State
(n = 3,515) |
| a. During the past 12 months | 73.1% | (± 6.7%) | 77.4% | (± 2.5%) |
| b. Between 12 and 24 months ago | 11.4 | (± 4.8) | 9.7 | (± 1.0) |
| c. More than 24 months ago | 6.6 | (± 3.8) | 4.8 | (± 0.9) |
| d. Never | 1.8 | (± 2.0) | 1.6 | (± 0.5) |
| e. Not sure | 7.2 | (± 3.9) | 6.5 | (± 1.2) |
Sexual Behavior
| 89. Have you ever had sexual intercourse?† | Local
(n = 0) | State
(n = 1,061) |
| a. Yes | *.*% | (± *.*%) | 31.2% | (± 4.9%) |
| b. No | *.* | (± *.*) | 68.8 | (± 4.9) |
| 90. How old were you when you had sexual intercourse for the first time?† | Local
(n = 0) | State
(n = 1,055) |
| a. I have never had sexual intercourse | *.*% | (± *.*%) | 68.8% | (± 5.3%) |
| b. 11 years old or younger | *.* | (± *.*) | 2.8 | (± 2.4) |
| c. 12 years old | *.* | (± *.*) | 2.8 | (± 1.0) |
| d. 13 years old | *.* | (± *.*) | 5.8 | (± 1.2) |
| e. 14 years old | *.* | (± *.*) | 7.8 | (± 1.8) |
| f. 15 years old | *.* | (± *.*) | 10.2 | (± 2.7) |
| g. 16 years old | *.* | (± *.*) | 1.1 | (± 0.7) |
| h. 17 years old or older | *.* | (± *.*) | 0.7 | (± 0.3) |
| 91. With how many people have you ever had sexual intercourse?† | Local
(n = 0) | State
(n = 1,056) |
| a. I have never had sexual intercourse | *.*% | (± *.*%) | 69.5% | (± 5.6%) |
| b. 1 person | *.* | (± *.*) | 13.0 | (± 3.3) |
| c. 2 people | *.* | (± *.*) | 6.6 | (± 1.9) |
| d. 3 people | *.* | (± *.*) | 3.3 | (± 1.5) |
| e. 4 people | *.* | (± *.*) | 2.4 | (± 0.7) |
| f. 5 people | *.* | (± *.*) | 1.4 | (± 0.6) |
| g. 6 or more people | *.* | (± *.*) | 3.8 | (± 1.3) |
| 92. The last time you had sexual intercourse, did you or your partner use a condom?† | Local
(n = 0) | State
(n = 1,055) |
| a. I have never had sexual intercourse | *.*% | (± *.*%) | 70.2% | (± 5.0%) |
| b. Yes | *.* | (± *.*) | 18.4 | (± 3.0) |
| c. No | *.* | (± *.*) | 11.4 | (± 2.4) |
Safety
| 93. When you rode a bicycle during the past 12 months, how often did you wear a helmet? | Local
(n = 170) | State
(n = 3,593) |
| a. I did not ride a bicycle in the past 12 months | 31.2% | (± 7.0%) | 24.6% | (± 2.4%) |
| b. Never wore a helmet | 40.6 | (± 7.4) | 41.9 | (± 4.3) |
| c. Rarely wore a helmet | 10.0 | (± 4.5) | 8.8 | (± 1.1) |
| d. Sometimes wore a helmet | 2.9 | (± 2.5) | 6.6 | (± 1.2) |
| e. Most of the time wore a helmet | 4.7 | (± 3.2) | 7.8 | (± 1.4) |
| f. Always wore a helmet | 10.6 | (± 4.6) | 10.3 | (± 1.9) |
| 95. How often do you wear a life vest when you’re in a small boat like a canoe, raft, or small motorboat? | Local
(n = 170) | State
(n = 3,596) |
| a. Never go boating in a small boat | 23.5% | (± 6.4%) | 23.4% | (± 2.6%) |
| b. Never | 12.4 | (± 4.9) | 12.3 | (± 1.5) |
| c. Less than half the time | 6.5 | (± 3.7) | 9.4 | (± 1.4) |
| d. About half the time | 8.2 | (± 4.1) | 9.3 | (± 1.2) |
| e. More than half the time | 16.5 | (± 5.6) | 13.7 | (± 1.5) |
| f. Always | 32.9 | (± 7.1) | 32.0 | (± 1.8) |
| 96. How often do you wear a seat belt when riding in a car (driven by someone else) B? | Local
(n = 170) | State
(n = 3,600) |
| a. Never | 2.9% | (± 2.5%) | 1.2% | (± 0.3%) |
| b. Rarely | 1.2 | (± 1.6) | 2.2 | (± 0.5) |
| c. Sometimes | 4.7 | (± 3.2) | 5.0 | (± 0.8) |
| d. Most of the time | 19.4 | (± 5.9) | 19.2 | (± 1.6) |
| e. Always | 71.8 | (± 6.8) | 72.4 | (± 1.9) |
| 97. During the past 30 days, how many times did you ride in a car or other vehicle driven by someone who had been drinking alcohol? | Local
(n = 332) | State
(n = 6,976) |
| a. 0 times | 80.1% | (± 4.3%) | 78.3% | (± 1.5%) |
| b. 1 time | 9.0 | (± 3.1) | 10.0 | (± 0.8) |
| c. 2–3 times | 6.9 | (± 2.7) | 7.0 | (± 0.7) |
| d. 4–5 times | 0.6 | (± 0.8) | 1.8 | (± 0.4) |
| e. 6 or more times | 3.3 | (± 1.9) | 2.8 | (± 0.5) |
| 99. During the past 30 days, how many times did you drive a car or other vehicle when you had been drinking alcohol? | Local
(n = 334) | State
(n = 6,940) |
| a. 0 times | 94.3% | (± 2.5%) | 92.9% | (± 1.2%) |
| b. 1 time | 2.7 | (± 1.7) | 3.5 | (± 0.7) |
| c. 2–3 times | 1.2 | (± 1.2) | 1.9 | (± 0.4) |
| d. 4–5 times | 0.0 | (± 0.0) | 0.7 | (± 0.2) |
| e. 6 or more times | 1.8 | (± 1.4) | 1.0 | (± 0.3) |
Behaviors Related to Intentional Injuries
| 100. During the past 30 days, on how many days did you carry a weapon such as a gun, knife, or club for self-protection or because you thought you might need it in a fight? (Do NOT include carrying a weapon for hunting, fishing, or camping.) | Local
(n = 170) | State
(n = 3,601) |
| a. 0 days | 87.7% | (± 4.9%) | 89.8% | (± 1.2%) |
| b. 1 day | 2.9 | (± 2.5) | 3.7 | (± 0.6) |
| c. 2–3 days | 1.8 | (± 2.0) | 2.1 | (± 0.5) |
| d. 4–5 days | 1.2 | (± 1.6) | 0.5 | (± 0.2) |
| e. 6 or more days | 6.5 | (± 3.7) | 3.9 | (± 0.6) |
| 102. During the past 30 days, on how many days did you carry a weapon such as a gun, knife, or club on school property? | Local
(n = 341) | State
(n = 7,189) |
| a. 0 days | 92.4% | (± 2.8%) | 93.3% | (± 0.8%) |
| b. 1–5 days | 3.8 | (± 2.0) | 4.1 | (± 0.6) |
| c. 6 or more days | 3.8 | (± 2.0) | 2.7 | (± 0.5) |
| 103. During the past 12 months, how many times were you in a physical fight? | Local
(n = 337) | State
(n = 7,151) |
| a. 0 times | 73.9% | (± 4.7%) | 74.3% | (± 1.6%) |
| b. 1 time | 14.0 | (± 3.7) | 12.4 | (± 0.8) |
| c. 2–3 times | 8.3 | (± 2.9) | 8.6 | (± 0.8) |
| d. 4–5 times | 1.5 | (± 1.3) | 1.6 | (± 0.3) |
| e. 6 or more times | 2.4 | (± 1.6) | 3.1 | (± 0.4) |
| 104. During the past 12 months, how many times were you in a physical fight on school property? | Local
(n = 168) | State
(n = 3,591) |
| a. 0 times | 92.3% | (± 4.0%) | 90.7% | (± 0.9%) |
| b. 1 time | 6.0 | (± 3.6) | 6.1 | (± 0.7) |
| c. 2–3 times | 0.6 | (± 1.2) | 2.0 | (± 0.4) |
| d. 4–5 times | 1.2 | (± 1.6) | 0.7 | (± 0.3) |
| e. 6 or more times | 0.0 | (± 0.0) | 0.6 | (± 0.3) |
| 105. During the past 12 months, have you been a member of a gang? | Local
(n = 335) | State
(n = 7,034) |
| a. No | 94.0% | (± 2.5%) | 93.8% | (± 0.9%) |
| b. Yes | 6.0 | (± 2.5) | 6.2 | (± 0.9) |
| 106. During the past 12 months, did your boyfriend or girlfriend ever limit your activities, threaten you, or make you feel unsafe in any other way?† | Local
(n = 155) | State
(n = 2,598) |
| a. No | 89.7% | (± 4.8%) | 91.1% | (± 1.6%) |
| b. Yes | 10.3 | (± 4.8) | 8.9 | (± 1.6) |
| 107. In the past 12 months, have you had any injuries such as bruises, cuts, black eyes, or broken bones as a result of being hurt by a boyfriend or girlfriend?† | Local
(n = 155) | State
(n = 2,592) |
| a. No | 94.8% | (± 3.5%) | 93.1% | (± 2.2%) |
| b. Yes | 5.2 | (± 3.5) | 6.9 | (± 2.2) |
| 108. Have you ever been physically abused by an adult?† | Local
(n = 156) | State
(n = 2,589) |
| a. No | 78.9% | (± 6.4%) | 81.7% | (± 1.8%) |
| b. Yes | 21.2 | (± 6.4) | 18.3 | (± 1.8) |
| 109. Not counting TV, movies, video games, and sporting events, have you seen an adult hit, slap, punch, shove, kick, or otherwise physically hurt another adult more than one time?† | Local
(n = 157) | State
(n = 2,582) |
| a. No | 67.5% | (± 7.3%) | 72.2% | (± 2.0%) |
| b. Yes | 32.5 | (± 7.3) | 27.8 | (± 2.0) |
Depression
| 110. During the past 12 months, did you ever feel so sad or hopeless almost every day for two weeks or more in a row that you stopped doing some usual activities? | Local
(n = 331) | State
(n = 6,889) |
| a. Yes | 29.0% | (± 4.9%) | 29.7% | (± 1.3%) |
| b. No | 71.0 | (± 4.9) | 70.3 | (± 1.3) |
| 111. During the past 12 months, did you ever seriously consider attempting suicide? | Local
(n = 331) | State
(n = 6,877) |
| a. Yes | 19.0% | (± 4.2%) | 17.7% | (± 1.3%) |
| b. No | 81.0 | (± 4.2) | 82.3 | (± 1.3) |
| 112. During the past 12 months, did you make a plan about how you would attempt suicide? | Local
(n = 169) | State
(n = 3,587) |
| a. Yes | 17.2% | (± 5.7%) | 12.3% | (± 1.1%) |
| b. No | 82.8 | (± 5.7) | 87.7 | (± 1.1) |
| 113. During the past 12 months, how many times did you actually attempt suicide? | Local
(n = 170) | State
(n = 3,587) |
| a. 0 times | 91.8% | (± 4.1%) | 92.8% | (± 0.9%) |
| b. 1 time | 4.1 | (± 3.0) | 4.1 | (± 0.6) |
| c. 2–3 times | 2.4 | (± 2.3) | 2.1 | (± 0.4) |
| d. 4–5 times | 0.6 | (± 1.2) | 0.3 | (± 0.2) |
| e. 6 or more times | 1.2 | (± 1.6) | 0.7 | (± 0.2) |
| 116. When you feel sad or hopeless, are there adults you can turn to for help? | Local
(n = 170) | State
(n = 3,575) |
| a. I never feel sad or hopeless | 22.4% | (± 6.3%) | 19.9% | (± 1.4%) |
| b. Yes | 40.6 | (± 7.4) | 49.0 | (± 1.9) |
| c. No | 17.7 | (± 5.7) | 14.6 | (± 1.5) |
| d. Not sure | 19.4 | (± 5.9) | 16.4 | (± 1.0) |
| 117. How likely would you be to seek help if you were feeling depressed or suicidal? | Local
(n = 165) | State
(n = 3,504) |
| a. I never feel depressed or suicidal | 43.6% | (± 7.6%) | 42.0% | (± 1.8%) |
| b. Very likely | 15.2 | (± 5.5) | 15.8 | (± 1.0) |
| c. Somewhat likely | 17.6 | (± 5.8) | 16.9 | (± 1.3) |
| d. Somewhat unlikely | 9.1 | (± 4.4) | 10.5 | (± 1.3) |
| e. Very unlikely | 14.6 | (± 5.4) | 14.8 | (± 1.2) |
| 118. How likely would you be to seek help for a friend who you thought might be depressed or suicidal? | Local
(n = 162) | State
(n = 3,479) |
| a. Very likely | 67.9% | (± 7.2%) | 61.7% | (± 1.7%) |
| b. Somewhat likely | 16.7 | (± 5.7) | 23.8 | (± 1.6) |
| c. Somewhat unlikely | 4.9 | (± 3.3) | 6.8 | (± 1.0) |
| d. Very unlikely | 10.5 | (± 4.7) | 7.7 | (± 1.0) |
| 119. Last year in school, did you hear or see information at your school about the warning signs of suicide and how to get help for yourself or a friend? | Local
(n = 166) | State
(n = 3,428) |
| a. Very likely | 67.5% | (± 7.1%) | 50.7% | (± 7.3%) |
| b. Somewhat likely | 21.7 | (± 6.3) | 36.6 | (± 6.0) |
| c. Somewhat unlikely | 10.8 | (± 4.7) | 12.8 | (± 1.8) |
| d. Very unlikely | 0.0 | (± 0.0) | 0.0 | (± 0.0) |
Gambling
| 120. In the past 12 months, how often have you gambled (bet) for money or possessions? | Local
(n = 164) | State
(n = 3,373) |
| a. Never in the past year | 72.0% | (± 6.9%) | 72.2% | (± 1.8%) |
| b. Once or twice in the past year | 14.6 | (± 5.4) | 15.3 | (± 1.2) |
| c. A few times in the past year | 8.5 | (± 4.3) | 8.0 | (± 0.8) |
| d. Once or twice a month | 1.8 | (± 2.1) | 2.4 | (± 0.5) |
| e. At least once a week | 3.1 | (± 2.6) | 2.1 | (± 0.6) |
| 121. Has YOUR gambling ever caused you problems at home, school or with your friends? | Local
(n = 164) | State
(n = 3,368) |
| a. I have not gambled | 73.2% | (± 6.8%) | 71.9% | (± 1.8%) |
| b. Yes | 1.8 | (± 2.1) | 3.5 | (± 0.9) |
| c. No | 25.0 | (± 6.6) | 24.6 | (± 1.7) |
School Climate
In the past few years Washington State has given increased attention to supportive learning environments. Students need a safe, nurturing, healthy, and civil learning environment if they are to be successful in school. This section provides information about student perceptions of school climate.
| 122. A student is being bullied when another student, or group of students, say or do nasty or unpleasant things to him or her. It is also bullying when a student is teased repeatedly in a way he or she doesn’t like. It is NOT bullying when two students of about the same strength argue or fight. In the last 30 days, how often have you been bullied? | Local
(n = 333) | State
(n = 7,004) |
| a. I have not been bullied | 82.3% | (± 4.1%) | 75.6% | (± 1.3%) |
| b. Once | 7.5 | (± 2.8) | 10.9 | (± 0.7) |
| c. 2–3 times | 6.0 | (± 2.5) | 7.2 | (± 0.5) |
| d. About once a week | 1.2 | (± 1.2) | 2.7 | (± 0.5) |
| e. Several times a week | 3.0 | (± 1.8) | 3.6 | (± 0.3) |
| 123. In the past 30 days, how often were you bullied, harassed, or intimidated at school or on your way to or from school because of your race, ethnicity, or national origin or what someone thought it was? | Local
(n = 166) | State
(n = 3,497) |
| a. 0 times | 89.8% | (± 4.6%) | 86.5% | (± 1.3%) |
| b. 1 time | 6.0 | (± 3.6) | 6.5 | (± 0.8) |
| c. 2 or 3 times | 2.4 | (± 2.3) | 3.1 | (± 0.6) |
| d. About once a week | 0.6 | (± 1.2) | 1.4 | (± 0.3) |
| e. Several times a week or more | 1.2 | (± 1.7) | 2.5 | (± 0.5) |
| 124. In the past 30 days, how often were you bullied, harassed, or intimidated at school or on your way to or from school because your religion or what someone thought it was? | Local
(n = 167) | State
(n = 3,500) |
| a. 0 times | 88.6% | (± 4.8%) | 88.9% | (± 1.4%) |
| b. 1 time | 5.4 | (± 3.4) | 5.8 | (± 0.8) |
| c. 2 or 3 times | 2.4 | (± 2.3) | 2.7 | (± 0.6) |
| d. About once a week | 1.8 | (± 2.0) | 0.9 | (± 0.3) |
| e. Several times a week or more | 1.8 | (± 2.0) | 1.7 | (± 0.4) |
| 125. In the past 30 days, how often were you bullied, harassed, or intimidated at school or on your way to or from school because someone thought you were gay, lesbian or bisexual (whether you are or are not)? | Local
(n = 167) | State
(n = 3,491) |
| a. 0 times | 91.0% | (± 4.3%) | 88.5% | (± 1.4%) |
| b. 1 time | 6.0 | (± 3.6) | 5.0 | (± 0.8) |
| c. 2 or 3 times | 1.2 | (± 1.6) | 3.2 | (± 0.7) |
| d. About once a week | 0.0 | (± 0.0) | 1.2 | (± 0.4) |
| e. Several times a week or more | 1.8 | (± 2.0) | 2.0 | (± 0.4) |
| 126. In the past 30 days, how often were you bullied, harassed, or intimidated at school or on your way to or from school because of your gender (being male or female)? This includes sexual jokes, gestures, or comments that make you feel uncomfortable. | Local
(n = 167) | State
(n = 3,485) |
| a. 0 times | 86.2% | (± 5.2%) | 82.0% | (± 1.5%) |
| b. 1 time | 3.6 | (± 2.8) | 7.6 | (± 0.8) |
| c. 2 or 3 times | 4.8 | (± 3.2) | 5.1 | (± 0.7) |
| d. About once a week | 2.4 | (± 2.3) | 2.2 | (± 0.6) |
| e. Several times a week or more | 3.0 | (± 2.6) | 3.2 | (± 0.7) |
| 127. In the past 30 days, how often were you bullied, harassed, or intimidated at school or on your way to or from school because you have a health problem or physical or mental disability, or because someone thought you did? | Local
(n = 166) | State
(n = 3,485) |
| a. 0 times | 92.2% | (± 4.1%) | 92.2% | (± 1.2%) |
| b. 1 time | 4.8 | (± 3.3) | 3.4 | (± 0.6) |
| c. 2 or 3 times | 1.2 | (± 1.7) | 2.1 | (± 0.5) |
| d. About once a week | 0.6 | (± 1.2) | 0.8 | (± 0.3) |
| e. Several times a week or more | 1.2 | (± 1.7) | 1.5 | (± 0.4) |
| 128. In the past 30 days, how often were you bullied, harassed, or intimidated at school or on your way to or from school because of any other reason? | Local
(n = 166) | State
(n = 3,482) |
| a. 0 times | 80.1% | (± 6.1%) | 77.4% | (± 1.7%) |
| b. 1 time | 7.2 | (± 3.9) | 9.6 | (± 0.8) |
| c. 2 or 3 times | 7.2 | (± 3.9) | 6.7 | (± 1.0) |
| d. About once a week | 1.8 | (± 2.0) | 2.6 | (± 0.6) |
| e. Several times a week or more | 3.6 | (± 2.8) | 3.8 | (± 0.7) |
| 129. During the past 30 days, on how many days did you not go to school because you felt you would be unsafe at school or on your way to and from school? | Local
(n = 165) | State
(n = 3,414) |
| a. 0 days | 92.1% | (± 4.1%) | 92.6% | (± 1.8%) |
| b. 1 day | 3.0 | (± 2.6) | 3.4 | (± 0.8) |
| c. 2 or 3 days | 3.6 | (± 2.9) | 2.7 | (± 0.8) |
| d. 4 or 5 days | 0.6 | (± 1.2) | 0.6 | (± 0.4) |
| e. 6 or more days | 0.6 | (± 1.2) | 0.8 | (± 0.3) |
| 130. In the past 30 days, has someone used the computer or a cell phone to bully, harass or intimidate you? | Local
(n = 166) | State
(n = 3,470) |
| a. Yes | 9.0% | (± 4.4%) | 11.6% | (± 1.4%) |
| b. No | 84.9 | (± 5.4) | 81.9 | (± 1.7) |
| c. I’m not sure | 6.0 | (± 3.6) | 6.5 | (± 0.9) |
| 131. Does your school provide a counselor, intervention specialist, or other school staff member for students to discuss problems with alcohol, tobacco, or other drugs? | Local
(n = 333) | State
(n = 6,922) |
| a. No | 9.0% | (± 3.1%) | 9.4% | (± 1.4%) |
| b. Yes | 57.7 | (± 5.3) | 59.0 | (± 3.4) |
| c. I’m not sure | 33.3 | (± 5.1) | 31.7 | (± 3.0) |
| 132. My school will punish students who are caught using drugs or alcohol. | Local
(n = 165) | State
(n = 3,501) |
| a. NO! | 3.0% | (± 2.6%) | 3.9% | (± 1.1%) |
| b. no | 4.2 | (± 3.1) | 5.9 | (± 1.2) |
| c. yes | 33.3 | (± 7.2) | 38.0 | (± 3.0) |
| d. YES! | 59.4 | (± 7.5) | 52.3 | (± 3.9) |
| 133. Last year in school, were you taught about HIV or AIDS infection? | Local
(n = 167) | State
(n = 3,436) |
| a. Yes | 87.4% | (± 5.0%) | 62.7% | (± 9.7%) |
| b. No | 7.8 | (± 4.1) | 29.7 | (± 8.5) |
| c. I’m not sure | 4.8 | (± 3.2) | 7.6 | (± 1.5) |
| 134. Last year in school, were you taught about abstinence (not having sex) to prevent sexually transmitted diseases (STDs) and pregnancy?† | Local
(n = 158) | State
(n = 2,578) |
| a. Yes | 86.1% | (± 5.4%) | 65.6% | (± 7.3%) |
| b. No | 10.1 | (± 4.7) | 25.6 | (± 6.6) |
| c. I don’t know | 3.8 | (± 3.0) | 8.8 | (± 1.6) |
| 135. Last year in school, were you taught about ways other than abstinence to prevent sexually transmitted diseases (STDs) and pregnancy?† | Local
(n = 157) | State
(n = 2,580) |
| a. Yes | 89.8% | (± 4.7%) | 66.4% | (± 7.8%) |
| b. No | 5.1 | (± 3.4) | 24.4 | (± 6.7) |
| c. I don’t know | 5.1 | (± 3.4) | 9.2 | (± 1.7) |
Quality of Life
Health-related quality of life is an individual’s or group’s perceived physical and mental health over time. At the individual level it involves a person’s health and health-related conditions; at the community level it involves conditions that influence people’s health. This section contains the results of the items related to individual quality of life.
| 136. Youth Quality of Life (Computed from items 137–142.) | Local
(n = 160) | State
(n = 3,325) |
| a. Low | 30.0% | (± 7.1%) | 23.6% | (± 2.6%) |
| b. Medium low | 15.6 | (± 5.6) | 25.8 | (± 1.3) |
| c. Medium high | 31.3 | (± 7.2) | 25.1 | (± 1.5) |
| d. High | 23.1 | (± 6.5) | 25.5 | (± 1.5) |
137. I feel I am getting along with my parents or guardians.
| Local
(n = 162) | State
(n = 3,377) |
| a. 0 not at all true | 3.7% | (± 2.9%) | 5.1% | (± 1.3%) |
| b. 1 | 1.9 | (± 2.1) | 2.4 | (± 0.7) |
| c. 2 | 3.1 | (± 2.7) | 2.5 | (± 0.6) |
| d. 3 | 3.7 | (± 2.9) | 3.5 | (± 0.6) |
| e. 4 | 4.3 | (± 3.1) | 3.7 | (± 0.6) |
| f. 5 | 3.7 | (± 2.9) | 7.0 | (± 1.0) |
| g. 6 | 8.0 | (± 4.2) | 6.1 | (± 0.9) |
| h. 7 | 13.0 | (± 5.2) | 11.8 | (± 1.2) |
| i. 8 | 17.9 | (± 5.9) | 15.3 | (± 1.5) |
| j. 9 | 16.7 | (± 5.7) | 14.4 | (± 1.5) |
| k. 10 completely true | 24.1 | (± 6.6) | 28.2 | (± 1.6) |
| 138. I look forward to the future. | Local
(n = 163) | State
(n = 3,369) |
| a. 0 not at all true | 4.3% | (± 3.1%) | 3.1% | (± 0.6%) |
| b. 1 | 0.6 | (± 1.2) | 1.3 | (± 0.4) |
| c. 2 | 0.6 | (± 1.2) | 1.9 | (± 0.6) |
| d. 3 | 1.2 | (± 1.7) | 2.1 | (± 0.6) |
| e. 4 | 3.7 | (± 2.9) | 2.1 | (± 0.6) |
| f. 5 | 5.5 | (± 3.5) | 5.4 | (± 0.7) |
| g. 6 | 4.9 | (± 3.3) | 4.5 | (± 0.6) |
| h. 7 | 8.6 | (± 4.3) | 7.4 | (± 1.0) |
| i. 8 | 11.7 | (± 4.9) | 11.3 | (± 1.3) |
| j. 9 | 13.5 | (± 5.3) | 12.8 | (± 1.4) |
| k. 10 completely true | 45.4 | (± 7.6) | 48.2 | (± 2.0) |
| 139. I feel good about myself. | Local
(n = 161) | State
(n = 3,364) |
| a. 0 not at all true | 3.7% | (± 2.9%) | 4.5% | (± 0.9%) |
| b. 1 | 3.7 | (± 2.9) | 2.2 | (± 0.8) |
| c. 2 | 3.7 | (± 2.9) | 3.0 | (± 0.7) |
| d. 3 | 3.1 | (± 2.7) | 3.4 | (± 0.5) |
| e. 4 | 4.4 | (± 3.2) | 3.7 | (± 0.6) |
| f. 5 | 8.1 | (± 4.2) | 7.3 | (± 1.1) |
| g. 6 | 5.6 | (± 3.5) | 7.3 | (± 0.8) |
| h. 7 | 11.8 | (± 5.0) | 12.1 | (± 1.3) |
| i. 8 | 15.5 | (± 5.6) | 15.6 | (± 1.3) |
| j. 9 | 18.0 | (± 5.9) | 15.3 | (± 1.8) |
| k. 10 completely true | 22.4 | (± 6.4) | 25.7 | (± 2.0) |
| 140. I am satisfied with the way my life is now. | Local
(n = 163) | State
(n = 3,365) |
| a. 0 not at all true | 7.4% | (± 4.0%) | 6.5% | (± 1.0%) |
| b. 1 | 4.3 | (± 3.1) | 2.7 | (± 0.5) |
| c. 2 | 4.3 | (± 3.1) | 4.0 | (± 0.8) |
| d. 3 | 5.5 | (± 3.5) | 4.2 | (± 0.9) |
| e. 4 | 6.1 | (± 3.7) | 5.0 | (± 0.6) |
| f. 5 | 5.5 | (± 3.5) | 7.7 | (± 1.0) |
| g. 6 | 8.0 | (± 4.2) | 8.2 | (± 0.9) |
| h. 7 | 9.2 | (± 4.4) | 11.2 | (± 1.0) |
| i. 8 | 14.1 | (± 5.4) | 14.3 | (± 1.3) |
| j. 9 | 16.6 | (± 5.7) | 14.7 | (± 1.5) |
| k. 10 completely true | 19.0 | (± 6.0) | 21.6 | (± 1.4) |
| 141. I feel alone in my life. | Local
(n = 163) | State
(n = 3,358) |
| a. 0 not at all true | 39.9% | (± 7.5%) | 41.4% | (± 2.2%) |
| b. 1 | 14.7 | (± 5.4) | 12.2 | (± 1.2) |
| c. 2 | 6.1 | (± 3.7) | 9.5 | (± 0.9) |
| d. 3 | 5.5 | (± 3.5) | 4.8 | (± 0.7) |
| e. 4 | 3.7 | (± 2.9) | 3.8 | (± 0.7) |
| f. 5 | 5.5 | (± 3.5) | 5.4 | (± 0.7) |
| g. 6 | 3.7 | (± 2.9) | 3.8 | (± 0.6) |
| h. 7 | 6.8 | (± 3.8) | 5.7 | (± 0.7) |
| i. 8 | 8.0 | (± 4.2) | 5.3 | (± 1.0) |
| j. 9 | 4.3 | (± 3.1) | 3.8 | (± 0.8) |
| k. 10 completely true | 1.8 | (± 2.1) | 4.5 | (± 0.8) |
| 142. Compared with others my age, my life is | Local
(n = 162) | State
(n = 3,355) |
| a. 0 much worse than others | 1.9% | (± 2.1%) | 3.9% | (± 1.1%) |
| b. 1 | 0.0 | (± 0.0) | 2.0 | (± 0.6) |
| c. 2 | 3.1 | (± 2.7) | 3.2 | (± 0.7) |
| d. 3 | 3.7 | (± 2.9) | 3.8 | (± 0.6) |
| e. 4 | 9.3 | (± 4.5) | 5.7 | (± 0.5) |
| f. 5 | 21.6 | (± 6.3) | 15.4 | (± 1.4) |
| g. 6 | 8.0 | (± 4.2) | 9.1 | (± 0.9) |
| h. 7 | 13.6 | (± 5.3) | 14.1 | (± 1.3) |
| i. 8 | 13.6 | (± 5.3) | 15.9 | (± 1.3) |
| j. 9 | 10.5 | (± 4.7) | 11.2 | (± 1.2) |
| k. 10 much better than others | 14.8 | (± 5.5) | 15.7 | (± 1.1) |
| 143. Which of the following best describes where you currently live? (Choose only one answer.) | Local
(n = 167) | State
(n = 3,466) |
| a. My parent’s or guardian’s home | 98.2% | (± 2.0%) | 95.3% | (± 1.5%) |
| b. With friends or other families (because lost home or cannot afford housing) | 1.8 | (± 2.0) | 1.9 | (± 0.6) |
| c. On your own (because lost home or cannot afford housing) | 0.0 | (± 0.0) | 0.6 | (± 0.4) |
| d. Motel or hotel | 0.0 | (± 0.0) | 0.5 | (± 0.3) |
| e. Shelter (shelter or emergency/transitional housing) | 0.0 | (± 0.0) | 0.3 | (± 0.3) |
| f. Car, park, campground, or other public place | 0.0 | (± 0.0) | 0.4 | (± 0.2) |
| g. Waiting to be placed in foster care | 0.0 | (± 0.0) | 0.3 | (± 0.2) |
| h. Another place | 0.0 | (± 0.0) | 0.8 | (± 0.3) |
| 144. Has your parent or guardian served in the military (Army, Navy, Air Force, Marines, Coast Guard, National Guard, and Reserves)? | Local
(n = 166) | State
(n = 3,462) |
| a. No | 71.7% | (± 6.9%) | 74.1% | (± 2.3%) |
| b. Yes | 26.5 | (± 6.7) | 22.5 | (± 2.1) |
| c. Not sure | 1.8 | (± 2.0) | 3.4 | (± 1.0) |
| 145. Has your military parent or guardian been sent to Iraq, Afghanistan, or other combat zone? | Local
(n = 166) | State
(n = 3,452) |
| a. I do not have a parent or guardian who has ever served in the military | 70.5% | (± 6.9%) | 70.4% | (± 2.4%) |
| b. No | 18.7% | (± 5.9%) | 19.3% | (± 1.6%) |
| c. Yes | 6.6 | (± 3.8) | 6.1 | (± 1.4) |
| d. Not sure | 4.2 | (± 3.1) | 4.1 | (± 0.5) |
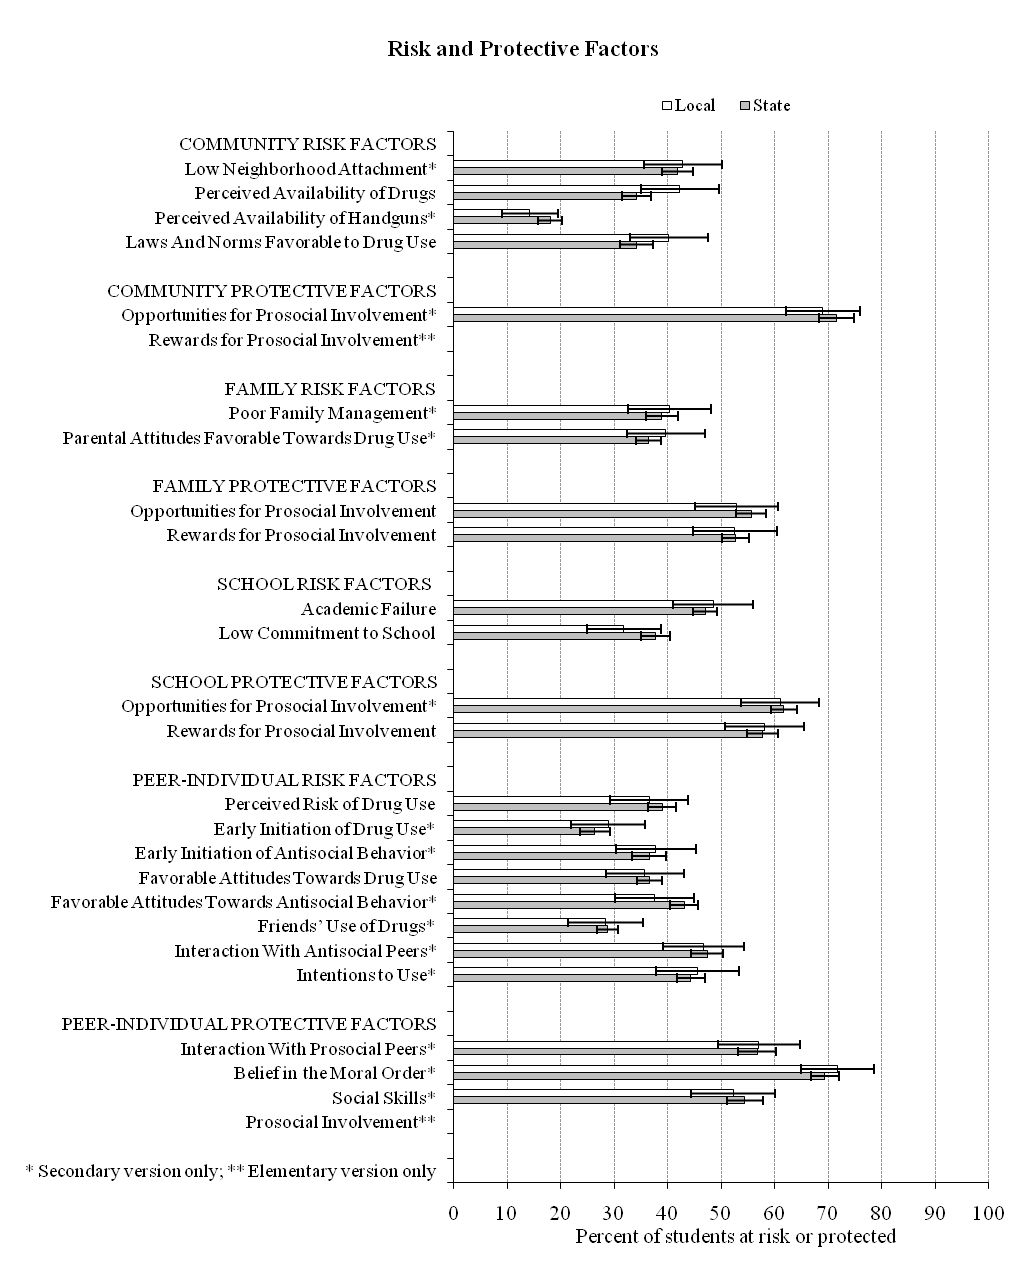
Risk and Protective Factors
Decades of research have shown that certain risk factors are associated with increased likelihood of health risk behaviors including ATOD use, violence, and delinquent behaviors. Similarly, research has shown that protective factors exert a positive influence against the negative influence of risk factors. The survey included substantial coverage of risk and protective factors based on the work of Drs. Hawkins and Catalano and associates at the University of Washington. The premise of the risk reduction and protective factor enhancement approach to prevention is that preventing a problem before it occurs requires addressing the factors that predict the problem. Ideally, this strategy entails discovering the causes of the problem behavior and influencing those causes. Many of the survey items were used to assess students’ status on risk and protective factors in the community, school, and peer-individual domains. Composite scales were computed for use in local program planning.
The table on the following page provides the complete list of risk and protective factors and indicates the years the Healthy Youth Survey has included each factor.
Cascade High School (Everett School District) Grade 10
Risk and Protective Factor Framework and Reporting Schedule
Healthy Youth Survey Administration Year
|
1995
| 1998
| 2000
| 2002
| 2004
| 2006
| 2008
| 2010
|
| Community Risk Factors |
| Low Neighborhood Attachment | X
| X
| X
| XS
| XS
| XS
| XS
|
| Community Disorganization | X
|
| Transitions and Mobility | X
| XS
|
| Perceived Availability of Drugs | X
| X
| X
| X
| X
| X
| X
| X
|
| Perceived Availability of Handguns | X
| X
| X
| XS
| XS
| XS
| XS
| XS
|
| Laws And Norms Favorable to Drug Use | X
| X
| X
| X
| X
| X
| X
| X
|
| Community Protective Factors |
| Opportunities for Prosocial Involvement | X
| X
| XS
| XS
| XS
| XS
|
| Rewards for Prosocial Involvement | X
| X
| X
| X
| X
| X
| X
| XE
|
| Family Risk Factors |
| Family History of Antisocial Behavior | X
|
| Poor Family Management | X
| XS,
†
| XS,
†
| XS,
†
| XS,
†
| XS,
†
|
| Family Conflict |
| Parental Attitudes Favorable towards Drug Use | XS,
†
| XS,
†
| XS
|
| Parental Attitudes Favorable to Antisocial Behavior | X
| XS,
†
|
| Antisocial Behavior Among Familiar Adults | XS
|
| Family Protective Factors |
| Attachment |
| Opportunities for Prosocial Involvement | X
| X
†
| XE,
†
| X
†
| X
†
| X
†
|
| Rewards for Prosocial Involvement | X
| X
†
| XE,
†
| X
†
| X
†
| X
†
|
| School Risk Factors |
| Academic Failure | X
| X
| X
| X
| X
| X
| X
| X
|
| Low Commitment to School | X
| X
| X
| X
| X
| X
| X
| X
|
| School Protective Factors |
| Opportunities for Prosocial Involvement | X
| X
| X
| XS
| XS
| XS
| XS
| XS
|
| Rewards for Prosocial Involvement | X
| X
| X
| X
| X
| X
| X
| X
|
| Peer-Individual Risk Factors |
| Rebelliousness | X
| X
|
| Gang Involvement |
| Perceived Risk of Drug Use | X
| X
| X
| X
| X
| X
| X
|
| Early Initiation of Drug Use | X
| XS
| XS
| XS
| XS
| XS
|
| Early Initiation of Antisocial Behavior | X
| X
| X
| XS
| XS
| XS
| XS
| XS
|
| Favorable Attitudes Towards Drug Use | X
| X
| X
| X
| X
| X
| X
| X
|
| Favorable Attitudes Towards Antisocial Behavior | X
| X
| X
| XS
| XS
| XS
| XS
| XS
|
| Sensation Seeking | X
| X
|
| Rewards for Antisocial Involvement | X
| X
| XS
| XS
| XS
| XS
|
| Friends’ Use of Drugs | X
| X
| X
| XS
| XS
| XS
| XS
| XS
|
| Interaction With Antisocial Peers | X
| X
| XS
| XS
| XS
| XS
|
| Intentions to Use | XS
| XS
| XS
| XS
| XS
|
| Peer-Individual Protective Factors |
| Interaction With Prosocial Peers | X
| X
| X
| XS
|
| Belief in the Moral Order | X
| X
| X
| XS
| XS
| XS
| XS
| XS
|
| Prosocial Involvement | X
| X
| XE
| XE
|
| Rewards for Prosocial Involvement |
| Social Skills | X
| X
| XS
| XS
| XS
| XS
| XS
| XS
|
| Religiosity | X
|
Risk and Protective Factor Scale Results
For each risk factor scale, the percentage of students who are at risk (i.e., who agreed with statements that predict ATOD use or other problem behaviors) is reported; higher percentages indicate that more students are likely to engage in problem behaviors. For each protective factor scale, the percentage of students who are resilient (i.e., who agreed with statements that predict the ability to resist ATOD use or other problem behaviors) is reported; higher percentages indicate that fewer students are likely to engage in problem behaviors. These percentages are based on computational methods provided by the University of Washington’s Social Development Research Group.
| Community Risk Factors | Local
| State
|
(n = 175)
| (n = 3,634)
|
| Low Neighborhood Attachment (Items 147–149) | 42.9% | (± 7.3%) | 41.9% | (± 2.9%) |
(n = 175)
| (n = 3,609)
|
| Perceived Availability of Drugs (Items 150–153) | 42.3% | (± 7.3%) | 34.2% | (± 2.7%) |
(n = 175)
| (n = 3,596)
|
| Perceived Availability of Handguns (Item 154) | 14.3% | (± 5.2%) | 18.1% | (± 2.3%) |
(n = 174)
| (n = 3,609)
|
| Laws And Norms Favorable to Drug Use (Items 155–160) | 40.2% | (± 7.3%) | 34.1% | (± 3.1%) |
| Community Protective Factors | Local
| State
|
(n = 171)
| (n = 3,564)
|
| Opportunities for Prosocial Involvement (Items 161–164) | 69.0% | (± 6.9%) | 71.5% | (± 3.3%) |
| Family Risk Factors | Local
| State
|
(n = 156)
| (n = 2,586)
|
| Poor Family Management (Items 168–175) | 40.4% | (± 7.7%) | 38.9% | (± 3.0%) |
(n = 174)
| (n = 3,635)
|
| Parental Attitudes Favorable Towards Drug Use (Items 183–185) | 39.7% | (± 7.3%) | 36.5% | (± 2.3%) |
| Family Protective Factors | Local
| State
|
(n = 157)
| (n = 2,620)
|
| Opportunities for Prosocial Involvement (Items 176–178) | 52.9% | (± 7.8%) | 55.6% | (± 2.8%) |
(n = 156)
| (n = 2,590)
|
| Rewards for Prosocial Involvement (Items 179–182) | 52.6% | (± 7.8%) | 52.7% | (± 2.6%) |
| School Risk Factors | Local
| State
|
(n = 171)
| (n = 3,538)
|
| Academic Failure (Items 186–187) | 48.5% | (± 7.5%) | 47.0% | (± 2.2%) |
(n = 173)
| (n = 3,630)
|
| Low Commitment to School (Items 188–194) | 31.8% | (± 6.9%) | 37.8% | (± 2.7%) |
| School Protective Factors | Local
| State
|
(n = 172)
| (n = 3,591)
|
| Opportunities for Prosocial Involvement (Items 195–199) | 61.1% | (± 7.3%) | 61.7% | (± 2.4%) |
(n = 172)
| (n = 3,595)
|
| Rewards for Prosocial Involvement (Items 200–203) | 58.1% | (± 7.4%) | 57.8% | (± 2.8%) |
| Peer-Individual Risk Factors | Local
| State
|
(n = 167)
| (n = 3,447)
|
| Perceived Risk of Drug Use (Items 204–207) | 36.5% | (± 7.3%) | 39.0% | (± 2.6%) |
(n = 166)
| (n = 3,467)
|
| Early Initiation of Drug Use (Items 210–211, 213) | 28.9% | (± 6.9%) | 26.4% | (± 2.8%) |
(n = 164)
| (n = 3,455)
|
| Early Initiation of Antisocial Behavior (Items 214–217) | 37.8% | (± 7.4%) | 36.6% | (± 3.1%) |
(n = 165)
| (n = 3,389)
|
| Favorable Attitudes Towards Drug Use (Items 218–221) | 35.8% | (± 7.3%) | 36.6% | (± 2.4%) |
(n = 165)
| (n = 3,426)
|
| Favorable Attitudes Towards Antisocial Behavior (Items 222–226) | 37.6% | (± 7.4%) | 43.1% | (± 2.6%) |
(n = 162)
| (n = 3,307)
|
| Friends’ Use of Drugs (Items 228–231) | 28.4% | (± 6.9%) | 28.8% | (± 2.0%) |
(n = 169)
| (n = 3,553)
|
| Interaction With Antisocial Peers (Items 232–237) | 46.8% | (± 7.5%) | 47.4% | (± 2.9%) |
(n = 160)
| (n = 3,299)
|
| Intentions to Use (Items 238–240) | 45.6% | (± 7.7%) | 44.4% | (± 2.7%) |
| Peer-Individual Protective Factors | Local
| State
|
(n = 163)
| (n = 3,326)
|
| Interaction With Prosocial Peers (Items 241–244) | 57.1% | (± 7.6%) | 56.8% | (± 3.5%) |
(n = 170)
| (n = 3,562)
|
| Belief in the Moral Order (Items 246–249) | 71.8% | (± 6.8%) | 69.4% | (± 2.6%) |
(n = 157)
| (n = 3,249)
|
| Social Skills (Items 253–255) | 52.2% | (± 7.8%) | 54.5% | (± 3.4%) |
Graph of Scale Results
Risk and Protective Factors: Individual Item Results
The remainder of the report provides results for the individual items used to compute the risk and protective factors.
Community Domain
| 147. I’d like to get out of my neighborhood or community. | Local
(n = 174) | State
(n = 3,624) |
| a. NO! | 19.5% | (± 5.9%) | 22.0% | (± 1.8%) |
| b. no | 53.5 | (± 7.4) | 46.2 | (± 2.0) |
| c. yes | 19.0 | (± 5.8) | 22.5 | (± 1.8) |
| d. YES! | 8.1 | (± 4.0) | 9.3 | (± 1.5) |
| 148. If I had to move, I would miss the neighborhood or community I now live in. | Local
(n = 174) | State
(n = 3,640) |
| a. NO! | 7.5% | (± 3.9%) | 6.8% | (± 1.2%) |
| b. no | 26.4 | (± 6.5) | 22.3 | (± 1.7) |
| c. yes | 44.3 | (± 7.4) | 46.0 | (± 1.6) |
| d. YES! | 21.8 | (± 6.1) | 24.9 | (± 2.2) |
| 149. I like my neighborhood/community. | Local
(n = 175) | State
(n = 3,622) |
| a. NO! | 2.3% | (± 2.2%) | 4.3% | (± 0.8%) |
| b. no | 20.6 | (± 6.0) | 14.5 | (± 1.7) |
| c. yes | 58.9 | (± 7.3) | 61.7 | (± 1.9) |
| d. YES! | 18.3 | (± 5.7) | 19.5 | (± 2.0) |
| 150. If you wanted to get some beer, wine, or hard liquor (for example, vodka, whiskey, or gin), how easy would it be for you to get some? | Local
(n = 175) | State
(n = 3,613) |
| a. Very hard | 16.0% | (± 5.4%) | 17.7% | (± 1.5%) |
| b. Sort of hard | 29.1 | (± 6.7) | 26.4 | (± 1.8) |
| c. Sort of easy | 32.0 | (± 6.9) | 30.6 | (± 1.5) |
| d. Very easy | 22.9 | (± 6.2) | 25.4 | (± 1.7) |
| 151. If you wanted to get some cigarettes, how easy would it be for you to get some? | Local
(n = 175) | State
(n = 3,606) |
| a. Very hard | 22.9% | (± 6.2%) | 24.6% | (± 2.2%) |
| b. Sort of hard | 20.0 | (± 5.9) | 23.2 | (± 1.5) |
| c. Sort of easy | 20.6 | (± 6.0) | 22.8 | (± 1.5) |
| d. Very easy | 36.6 | (± 7.1) | 29.4 | (± 3.0) |
| 152. If you wanted to get some marijuana, how easy would it be for you to get some? | Local
(n = 175) | State
(n = 3,608) |
| a. Very hard | 26.3% | (± 6.5%) | 28.1% | (± 2.3%) |
| b. Sort of hard | 17.1 | (± 5.6) | 17.8 | (± 1.2) |
| c. Sort of easy | 20.6 | (± 6.0) | 20.9 | (± 1.3) |
| d. Very easy | 36.0 | (± 7.1) | 33.2 | (± 2.5) |
| 153. If you wanted to get a drug like cocaine, LSD, or amphetamines, how easy would it be for you to get some? | Local
(n = 174) | State
(n = 3,599) |
| a. Very hard | 47.7% | (± 7.4%) | 51.4% | (± 3.1%) |
| b. Sort of hard | 25.3 | (± 6.5) | 24.0 | (± 1.6) |
| c. Sort of easy | 16.7 | (± 5.5) | 16.1 | (± 1.8) |
| d. Very easy | 10.3 | (± 4.5) | 8.6 | (± 1.2) |
| 154. If you wanted to get a handgun, how easy would it be for you to get one? | Local
(n = 175) | State
(n = 3,596) |
| a. Very hard | 67.4% | (± 6.9%) | 58.2% | (± 3.4%) |
| b. Sort of hard | 18.3 | (± 5.7) | 23.8 | (± 1.7) |
| c. Sort of easy | 8.6 | (± 4.2) | 10.2 | (± 1.3) |
| d. Very easy | 5.7 | (± 3.4) | 7.9 | (± 1.3) |
| 155. How wrong would most adults in your neighborhoodC/ neighborhood or communityA think it was for kids your age to use marijuana? | Local
(n = 174) | State
(n = 3,629) |
| a. Very wrong | 48.9% | (± 7.4%) | 51.5% | (± 3.3%) |
| b. Wrong | 29.3 | (± 6.8) | 30.6 | (± 1.7) |
| c. A little bit wrong | 16.7 | (± 5.5) | 13.2 | (± 1.8) |
| d. Not wrong at all | 5.2 | (± 3.3) | 4.7 | (± 1.0) |
| 156. How wrong would most adults in your neighborhoodC/ neighborhood or communityA think it was for kids your age to drink alcohol? | Local
(n = 174) | State
(n = 3,624) |
| a. Very wrong | 39.7% | (± 7.3%) | 36.0% | (± 2.5%) |
| b. Wrong | 38.5 | (± 7.2) | 39.9 | (± 1.6) |
| c. A little bit wrong | 16.1 | (± 5.5) | 18.6 | (± 1.8) |
| d. Not wrong at all | 5.8 | (± 3.4) | 5.5 | (± 1.1) |
| 157. How wrong would most adults in your neighborhoodC/ neighborhood or communityA think it was for kids your age to smoke cigarettes? | Local
(n = 174) | State
(n = 3,625) |
| a. Very wrong | 40.2% | (± 7.3%) | 45.4% | (± 2.9%) |
| b. Wrong | 35.1 | (± 7.1) | 34.6 | (± 1.5) |
| c. A little bit wrong | 16.7 | (± 5.5) | 14.1 | (± 1.5) |
| d. Not wrong at all | 8.1 | (± 4.0) | 5.9 | (± 1.2) |
| 158. If a kid drank some beer, wine, or hard liquor (for example, vodka, whiskey, or gin) in your neighborhoodC/ communityA would he or she be caught by the police? | Local
(n = 174) | State
(n = 3,597) |
| a. NO! | 15.5% | (± 5.4%) | 17.0% | (± 1.8%) |
| b. no | 60.9 | (± 7.3) | 57.0 | (± 1.6) |
| c. yes | 20.1 | (± 6.0) | 21.2 | (± 1.5) |
| d. YES! | 3.5 | (± 2.7) | 4.8 | (± 0.6) |
| 159. If a kid carried a handgun in your neighborhoodC/ communityA would he or she be caught by the police? | Local
(n = 173) | State
(n = 3,589) |
| a. NO! | 11.0% | (± 4.7%) | 7.2% | (± 0.8%) |
| b. no | 30.1 | (± 6.8) | 28.4 | (± 2.0) |
| c. yes | 41.0 | (± 7.3) | 42.8 | (± 2.2) |
| d. YES! | 17.9 | (± 5.7) | 21.6 | (± 1.3) |
| 160. If a kid smoked marijuana in your neighborhoodC/ communityA would he or she be caught by the police? | Local
(n = 175) | State
(n = 3,595) |
| a. NO! | 18.3% | (± 5.7%) | 17.3% | (± 2.0%) |
| b. no | 46.9 | (± 7.4) | 51.4 | (± 1.5) |
| c. yes | 26.9 | (± 6.6) | 23.9 | (± 1.5) |
| d. YES! | 8.0 | (± 4.0) | 7.4 | (± 0.8) |
| 161. There are adults in my neighborhood or community I could talk to about something important. | Local
(n = 174) | State
(n = 3,625) |
| a. NO! | 12.6% | (± 4.9%) | 11.3% | (± 1.4%) |
| b. no | 17.2 | (± 5.6) | 17.2 | (± 1.6) |
| c. yes | 42.5 | (± 7.4) | 43.6 | (± 1.7) |
| d. YES! | 27.6 | (± 6.6) | 27.9 | (± 2.3) |
Which of the following activities for people your age are available in your community?
| 162. Sports teams and recreation | Local
(n = 174) | State
(n = 3,628) |
| a. Yes | 83.3% | (± 5.5%) | 88.9% | (± 2.1%) |
| b. No | 16.7 | (± 5.5) | 11.1 | (± 2.1) |
| 163. Scouts, Camp Fire, 4-H Clubs, or other service clubs | Local
(n = 174) | State
(n = 3,603) |
| a. Yes | 69.5% | (± 6.8%) | 71.9% | (± 3.4%) |
| b. No | 30.5 | (± 6.8) | 28.1 | (± 3.4) |
| 164. Boys and Girls Club, YMCA, or other activity clubs | Local
(n = 174) | State
(n = 3,597) |
| a. Yes | 81.6% | (± 5.8%) | 73.7% | (± 4.7%) |
| b. No | 18.4 | (± 5.8) | 26.3 | (± 4.7) |
Family Domain
The next set of questions asks about your family. When answering these questions, please think about the people you consider to be your family—parents, stepparents, grandparents, aunts, uncles, etc.
| 168. My parents ask if I’ve gotten my homework done.† | Local
(n = 157) | State
(n = 2,638) |
| a. NO! | 4.5% | (± 3.2%) | 7.0% | (± 1.6%) |
| b. no | 12.7 | (± 5.2) | 11.1 | (± 1.6) |
| c. yes | 40.1 | (± 7.7) | 39.4 | (± 1.8) |
| d. YES! | 42.7 | (± 7.7) | 42.5 | (± 3.1) |
| 169. Would your parents know if you did not come home on time?† | Local
(n = 155) | State
(n = 2,591) |
| a. NO! | 5.8% | (± 3.7%) | 4.7% | (± 1.3%) |
| b. no | 13.6 | (± 5.4) | 14.7 | (± 1.5) |
| c. yes | 41.9 | (± 7.8) | 45.1 | (± 2.4) |
| d. YES! | 38.7 | (± 7.7) | 35.5 | (± 2.4) |
| 170. When I am not at home, one of my parents knows where I am and who I am with.† | Local
(n = 156) | State
(n = 2,625) |
| a. NO! | 3.9% | (± 3.0%) | 4.5% | (± 1.5%) |
| b. no | 9.6 | (± 4.6) | 10.9 | (± 1.4) |
| c. yes | 48.1 | (± 7.8) | 46.2 | (± 2.3) |
| d. YES! | 38.5 | (± 7.6) | 38.4 | (± 2.3) |
| 171. The rules in my family are clear.† | Local
(n = 157) | State
(n = 2,621) |
| a. NO! | 1.9% | (± 2.1%) | 4.4% | (± 1.1%) |
| b. no | 15.3 | (± 5.6) | 11.8 | (± 1.5) |
| c. yes | 47.1 | (± 7.8) | 44.7 | (± 2.3) |
| d. YES! | 35.7 | (± 7.5) | 39.2 | (± 2.0) |
| 172. My family has clear rules about alcohol and drug use.† | Local
(n = 157) | State
(n = 2,611) |
| a. NO! | 5.7% | (± 3.6%) | 5.8% | (± 1.6%) |
| b. no | 12.7 | (± 5.2) | 14.9 | (± 1.6) |
| c. yes | 38.2 | (± 7.6) | 33.7 | (± 2.4) |
| d. YES! | 43.3 | (± 7.7) | 45.6 | (± 2.5) |
| 173. If you drank some beer, wine, or liquor (for example, vodka, whiskey, or gin) without your parent’s permission, would you be caught by them?† | Local
(n = 155) | State
(n = 2,578) |
| a. NO! | 14.2% | (± 5.5%) | 12.3% | (± 1.7%) |
| b. no | 34.8 | (± 7.5) | 38.2 | (± 2.4) |
| c. yes | 23.9 | (± 6.7) | 26.1 | (± 1.3) |
| d. YES! | 27.1 | (± 7.0) | 23.4 | (± 2.4) |
| 174. If you carried a handgun without your parent’s permission, would you be caught by them?† | Local
(n = 156) | State
(n = 2,582) |
| a. NO! | 7.1% | (± 4.0%) | 7.6% | (± 1.6%) |
| b. no | 18.6 | (± 6.1) | 17.7 | (± 1.5) |
| c. yes | 30.1 | (± 7.2) | 29.1 | (± 1.7) |
| d. YES! | 44.2 | (± 7.8) | 45.7 | (± 2.4) |
| 175. If you skipped school, would you be caught by your parents?† | Local
(n = 156) | State
(n = 2,585) |
| a. NO! | 6.4% | (± 3.8%) | 6.4% | (± 1.6%) |
| b. no | 9.0 | (± 4.5) | 14.7 | (± 1.8) |
| c. yes | 34.6 | (± 7.5) | 34.3 | (± 2.6) |
| d. YES! | 50.0 | (± 7.8) | 44.6 | (± 3.0) |
| 176. If I had a personal problem, I could ask my mom or dad for help.† | Local
(n = 157) | State
(n = 2,624) |
| a. NO! | 5.7% | (± 3.6%) | 9.4% | (± 1.5%) |
| b. no | 17.2 | (± 5.9) | 16.5 | (± 1.7) |
| c. yes | 48.4 | (± 7.8) | 40.2 | (± 2.0) |
| d. YES! | 28.7 | (± 7.1) | 33.9 | (± 2.7) |
| 177. My parents give me lots of chances to do fun things with them.† | Local
(n = 156) | State
(n = 2,610) |
| a. NO! | 9.6% | (± 4.6%) | 8.4% | (± 1.4%) |
| b. no | 29.5 | (± 7.2) | 22.7 | (± 1.8) |
| c. yes | 41.0 | (± 7.7) | 43.1 | (± 2.0) |
| d. YES! | 19.9 | (± 6.3) | 25.7 | (± 1.8) |
| 178. My parents ask me what I think before most family decisions affecting me are made.† | Local
(n = 157) | State
(n = 2,597) |
| a. NO! | 10.8% | (± 4.9%) | 12.3% | (± 1.8%) |
| b. no | 26.1 | (± 6.9) | 24.8 | (± 1.9) |
| c. yes | 40.8 | (± 7.7) | 41.4 | (± 2.1) |
| d. YES! | 22.3 | (± 6.5) | 21.5 | (± 1.7) |
| 179. My parents notice when I am doing a good job and let me know about it.† | Local
(n = 155) | State
(n = 2,603) |
| a. Never or almost never | 11.6% | (± 5.0%) | 11.2% | (± 2.0%) |
| b. Sometimes | 31.0 | (± 7.3) | 29.7 | (± 2.1) |
| c. Often | 32.3 | (± 7.4) | 33.5 | (± 1.9) |
| d. All the time | 25.2 | (± 6.8) | 25.6 | (± 2.6) |
| 180. How often do your parents tell you they’re proud of you for something you’ve done?† | Local
(n = 156) | State
(n = 2,597) |
| a. Never or almost never | 11.5% | (± 5.0%) | 12.4% | (± 1.4%) |
| b. Sometimes | 34.0 | (± 7.4) | 29.1 | (± 2.0) |
| c. Often | 28.9 | (± 7.1) | 31.5 | (± 1.7) |
| d. All the time | 25.6 | (± 6.9) | 27.0 | (± 2.3) |
| 181. Do you enjoy spending time with your momC/motherA?† | Local
(n = 155) | State
(n = 2,579) |
| a. NO! | 5.8% | (± 3.7%) | 6.8% | (± 1.4%) |
| b. no | 9.0 | (± 4.5) | 12.5 | (± 1.5) |
| c. yes | 52.9 | (± 7.9) | 47.3 | (± 2.4) |
| d. YES! | 32.3 | (± 7.4) | 33.4 | (± 2.3) |
| 182. Do you enjoy spending time with your dadC/fatherA?† | Local
(n = 150) | State
(n = 2,558) |
| a. NO! | 10.7% | (± 4.9%) | 11.2% | (± 1.5%) |
| b. no | 12.7 | (± 5.3) | 12.9 | (± 1.5) |
| c. yes | 48.7 | (± 8.0) | 42.9 | (± 2.4) |
| d. YES! | 28.0 | (± 7.2) | 33.0 | (± 2.2) |
| 183. How wrong do your parents feel it would be for you to drink beer, wine, or hard liquor (for example: vodka, whiskey, or gin) regularly (at least once or twice a month)? | Local
(n = 175) | State
(n = 3,634) |
| a. Very wrong | 68.6% | (± 6.9%) | 71.8% | (± 2.1%) |
| b. Wrong | 19.4 | (± 5.9) | 16.7 | (± 1.4) |
| c. A little bit wrong | 10.3 | (± 4.5) | 8.7 | (± 0.9) |
| d. Not wrong at all
| 1.7 | (± 1.9) | 2.9 | (± 0.8) |
| 184. How wrong do your parents feel it would be for you to smoke cigarettes? | Local
(n = 174) | State
(n = 3,635) |
| a. Very wrong | 81.0% | (± 5.8%) | 82.5% | (± 1.7%) |
| b. Wrong | 12.6 | (± 4.9) | 11.4 | (± 1.1) |
| c. A little bit wrong | 3.5 | (± 2.7) | 3.8 | (± 0.7) |
| d. Not wrong at all
| 2.9 | (± 2.5) | 2.4 | (± 0.7) |
| 185. How wrong do your parents feel it would be for you to smoke marijuana? | Local
(n = 174) | State
(n = 3,635) |
| a. Very wrong | 76.4% | (± 6.3%) | 77.6% | (± 2.0%) |
| b. Wrong | 9.8 | (± 4.4) | 12.2 | (± 1.2) |
| c. A little bit wrong | 8.1 | (± 4.0) | 5.9 | (± 1.0) |
| d. Not wrong at all | 5.8 | (± 3.4) | 4.3 | (± 0.8) |
School Domain
| 186. Putting them all together, what were your grades like last year? | Local
(n = 336) | State
(n = 7,012) |
| a. Mostly As | 36.0% | (± 5.1%) | 39.2% | (± 2.9%) |
| b. Mostly Bs | 36.9 | (± 5.2) | 32.4 | (± 1.7) |
| c. Mostly Cs | 20.8 | (± 4.4) | 19.1 | (± 1.6) |
| d. Mostly Ds | 4.5 | (± 2.2) | 5.8 | (± 0.9) |
| e. Mostly Fs | 1.8 | (± 1.4) | 3.6 | (± 0.7) |
| 187. Are your school grades better than the grades of most students in your class? | Local
(n = 172) | State
(n = 3,561) |
| a. NO! | 8.1% | (± 4.1%) | 7.8% | (± 1.1%) |
| b. no | 31.4 | (± 6.9) | 32.0 | (± 2.1) |
| c. yes | 45.4 | (± 7.4) | 45.8 | (± 1.5) |
| d. YES! | 15.1 | (± 5.4) | 14.5 | (± 1.1) |
| 188. How often do you feel the schoolwork you are assigned is meaningful and important? | Local
(n = 173) | State
(n = 3,566) |
| a. Almost always | 19.7% | (± 5.9%) | 14.6% | (± 1.1%) |
| b. Often | 19.7 | (± 5.9) | 25.6 | (± 1.5) |
| c. Sometimes | 35.8 | (± 7.2) | 35.5 | (± 1.4) |
| d. Seldom | 16.8 | (± 5.6) | 17.4 | (± 1.5) |
| e. Never | 8.1 | (± 4.1) | 6.9 | (± 1.2) |
| 189. How interesting are most of your courses to you? | Local
(n = 175) | State
(n = 3,626) |
| a. Very interesting and stimulating | 11.4% | (± 4.7%) | 7.7% | (± 1.3%) |
| b. Quite interesting | 28.0 | (± 6.6) | 27.8 | (± 1.8) |
| c. Fairly interesting | 37.1 | (± 7.2) | 36.9 | (± 1.8) |
| d. Slightly dull | 16.0 | (± 5.4) | 19.9 | (± 2.1) |
| e. Very dull | 7.4 | (± 3.9) | 7.8 | (± 0.9) |
| 190. How important do you think the things you are learning in school are going to be for you later in life? | Local
(n = 174) | State
(n = 3,629) |
| a. Very important | 25.9% | (± 6.5%) | 23.2% | (± 1.8%) |
| b. Quite important | 26.4 | (± 6.5) | 28.1 | (± 1.9) |
| c. Fairly important | 27.6 | (± 6.6) | 29.5 | (± 1.9) |
| d. Slightly important | 16.1 | (± 5.5) | 15.0 | (± 1.4) |
| e. Not at all important | 4.0 | (± 2.9) | 4.2 | (± 0.7) |
Think back over the past year in school. How often did you:
| 191. Enjoy being in school? | Local
(n = 340) | State
(n = 7,049) |
| a. Never | 7.1% | (± 2.7%) | 8.2% | (± 1.1%) |
| b. Seldom | 12.1 | (± 3.5) | 15.7 | (± 0.9) |
| c. Sometimes | 29.7 | (± 4.9) | 34.0 | (± 1.1) |
| d. Often | 33.5 | (± 5.0) | 28.8 | (± 1.7) |
| e. Almost always | 17.7 | (± 4.1) | 13.3 | (± 1.1) |
| 192. Hate being in school? | Local
(n = 173) | State
(n = 3,622) |
| a. Never | 9.8% | (± 4.4%) | 7.8% | (± 0.8%) |
| b. Seldom | 33.5 | (± 7.0) | 26.8 | (± 2.2) |
| c. Sometimes | 28.9 | (± 6.8) | 38.6 | (± 1.8) |
| d. Often | 15.6 | (± 5.4) | 17.6 | (± 1.6) |
| e. Almost always | 12.1 | (± 4.9) | 9.2 | (± 1.1) |
| 193. Try to do your best work in school? | Local
(n = 172) | State
(n = 3,616) |
| a. Never | 3.5% | (± 2.7%) | 1.9% | (± 0.6%) |
| b. Seldom | 6.4 | (± 3.7) | 7.3 | (± 1.1) |
| c. Sometimes | 19.2 | (± 5.9) | 17.2 | (± 1.2) |
| d. Often | 29.7 | (± 6.8) | 33.2 | (± 1.6) |
| e. Almost always | 41.3 | (± 7.4) | 40.4 | (± 2.3) |
| 194. During the LAST 4 WEEKS, how many whole days of school have you missed because you skipped or “cut”? | Local
(n = 173) | State
(n = 3,622) |
| a. None | 79.8% | (± 6.0%) | 79.0% | (± 2.6%) |
| b. 1 | 4.6 | (± 3.1) | 8.5 | (± 1.3) |
| c. 2 | 6.9 | (± 3.8) | 3.8 | (± 0.7) |
| d. 3 | 3.5 | (± 2.7) | 3.5 | (± 0.7) |
| e. 4–5 | 2.9 | (± 2.5) | 2.7 | (± 0.8) |
| f. 6–10 | 1.2 | (± 1.6) | 1.2 | (± 0.5) |
| g. 11 or more | 1.2 | (± 1.6) | 1.4 | (± 0.4) |
| 195. In my school, students have lots of chances to help decide things like class activities and rules. | Local
(n = 172) | State
(n = 3,592) |
| a. NO! | 11.6% | (± 4.8%) | 17.8% | (± 1.2%) |
| b. no | 33.7 | (± 7.1) | 36.7 | (± 2.2) |
| c. yes | 45.4 | (± 7.4) | 36.3 | (± 1.6) |
| d. YES! | 9.3 | (± 4.3) | 9.2 | (± 1.5) |
| 196. There are lots of chances for students in my school to talk with a teacher one-on-one. | Local
(n = 173) | State
(n = 3,602) |
| a. NO! | 5.8% | (± 3.5%) | 5.1% | (± 0.8%) |
| b. no | 20.8 | (± 6.1) | 16.3 | (± 1.8) |
| c. yes | 52.0 | (± 7.4) | 57.2 | (± 1.5) |
| d. YES! | 21.4 | (± 6.1) | 21.4 | (± 1.9) |
| 197. Teachers ask me to work on special classroom projects. | Local
(n = 173) | State
(n = 3,571) |
| a. NO! | 14.5% | (± 5.2%) | 16.8% | (± 1.2%) |
| b. no | 52.6 | (± 7.4) | 50.1 | (± 1.3) |
| c. yes | 26.0 | (± 6.5) | 27.9 | (± 1.6) |
| d. YES! | 6.9 | (± 3.8) | 5.2 | (± 0.7) |
| 198. There are lots of chances for students in my school to get involved in sports, clubs, and other school activities outside of class. | Local
(n = 171) | State
(n = 3,606) |
| a. NO! | 2.3% | (± 2.3%) | 2.3% | (± 0.6%) |
| b. no | 5.3 | (± 3.4) | 5.3 | (± 1.2) |
| c. yes | 45.0 | (± 7.4) | 38.6 | (± 2.8) |
| d. YES! | 47.4 | (± 7.5) | 53.7 | (± 3.4) |
| 199. I have lots of chances to be part of class discussions or activities. | Local
(n = 172) | State
(n = 3,599) |
| a. NO! | 1.7% | (± 2.0%) | 3.3% | (± 0.9%) |
| b. no | 8.1 | (± 4.1) | 12.0 | (± 1.3) |
| c. yes | 60.5 | (± 7.3) | 58.3 | (± 1.7) |
| d. YES! | 29.7 | (± 6.8) | 26.5 | (± 2.4) |
| 200. My teacher(s) notices when I am doing a good job and lets me know about it. | Local
(n = 172) | State
(n = 3,598) |
| a. NO! | 8.1% | (± 4.1%) | 9.5% | (± 1.1%) |
| b. no | 34.3 | (± 7.1) | 31.6 | (± 2.0) |
| c. yes | 47.7 | (± 7.5) | 47.4 | (± 2.4) |
| d. YES! | 9.9 | (± 4.5) | 11.5 | (± 1.0) |
| 201. The school lets my parents know when I have done something well. | Local
(n = 172) | State
(n = 3,588) |
| a. NO! | 24.4% | (± 6.4%) | 29.7% | (± 2.0%) |
| b. no | 51.7 | (± 7.5) | 46.0 | (± 2.4) |
| c. yes | 17.4 | (± 5.7) | 19.2 | (± 1.8) |
| d. YES! | 6.4 | (± 3.7) | 5.1 | (± 1.1) |
| 202. I feel safe at my school. | Local
(n = 342) | State
(n = 7,182) |
| a. NO!A,C / Definitely NOT trueB | 6.7% | (± 2.6%) | 4.7% | (± 1.0%) |
| b. noA,C / Mostly not trueB | 11.1 | (± 3.3) | 10.7 | (± 1.6) |
| c. yesA,C / Mostly trueB | 57.6 | (± 5.2) | 57.2 | (± 2.4) |
| d. YES! A,C / Definitely trueB | 24.6 | (± 4.6) | 27.4 | (± 3.3) |
| 203. My teachers praise me when I work hard in school. | Local
(n = 172) | State
(n = 3,588) |
| a. NO! | 15.1% | (± 5.4%) | 16.3% | (± 1.5%) |
| b. no | 44.2 | (± 7.4) | 44.1 | (± 2.1) |
| c. yes | 36.6 | (± 7.2) | 33.2 | (± 2.2) |
| d. YES! | 4.1 | (± 3.0) | 6.5 | (± 0.9) |
Peer and Individual Domain
How much do you think people risk harming themselves if they:
| 204. Smoke one or more packs of cigarettes per day? | Local
(n = 173) | State
(n = 3,578) |
| a. No risk | 1.7% | (± 1.9%) | 2.2% | (± 0.7%) |
| b. Slight risk | 4.6 | (± 3.1) | 4.1 | (± 0.7) |
| c. Moderate risk | 13.3 | (± 5.1) | 15.5 | (± 1.7) |
| d. Great risk | 78.0 | (± 6.2) | 74.6 | (± 3.1) |
| e. Not sure | 2.3 | (± 2.2) | 3.6 | (± 1.2) |
| 205. Try marijuana once or twice? | Local
(n = 171) | State
(n = 3,561) |
| a. No risk | 32.8% | (± 7.0%) | 31.0% | (± 2.3%) |
| b. Slight risk | 24.0 | (± 6.4) | 27.8 | (± 1.6) |
| c. Moderate risk | 16.4 | (± 5.5) | 19.4 | (± 1.5) |
| d. Great risk | 25.7 | (± 6.5) | 18.5 | (± 1.5) |
| e. Not sure | 1.2 | (± 1.6) | 3.4 | (± 0.8) |
| 206. Smoke marijuana regularly (at least once or twice a week)? | Local
(n = 173) | State
(n = 3,562) |
| a. No risk | 13.9% | (± 5.2%) | 12.7% | (± 1.6%) |
| b. Slight risk | 9.8 | (± 4.4) | 14.4 | (± 1.1) |
| c. Moderate risk | 24.3 | (± 6.4) | 22.2 | (± 1.3) |
| d. Great risk | 48.0 | (± 7.4) | 46.6 | (± 3.0) |
| e. Not sure | 4.1 | (± 2.9) | 4.1 | (± 1.2) |
| 207. Take one or two drinks of an alcoholic beverage (wine, beer, a shot, liquor) nearly every day? | Local
(n = 172) | State
(n = 3,562) |
| a. No risk | 12.2% | (± 4.9%) | 10.2% | (± 1.6%) |
| b. Slight risk | 13.4 | (± 5.1) | 17.4 | (± 1.7) |
| c. Moderate risk | 25.6 | (± 6.5) | 29.3 | (± 1.7) |
| d. Great risk | 44.8 | (± 7.4) | 39.4 | (± 3.1) |
| e. Not sure | 4.1 | (± 3.0) | 3.7 | (± 1.0) |
How old were you the first time you:
| 208. Smoked marijuana? | Local
(n = 334) | State
(n = 7,048) |
| a. Never have | 66.2% | (± 5.1%) | 69.3% | (± 2.4%) |
| b. 10 or younger | 0.9 | (± 1.0) | 2.4 | (± 0.5) |
| c. 11 | 2.4 | (± 1.6) | 2.1 | (± 0.5) |
| d. 12 | 2.7 | (± 1.7) | 3.7 | (± 0.7) |
| e. 13 | 10.2 | (± 3.2) | 6.0 | (± 0.7) |
| f. 14 | 9.3 | (± 3.1) | 8.7 | (± 1.1) |
| g. 15 | 7.8 | (± 2.9) | 7.0 | (± 0.9) |
| h. 16 | 0.6 | (± 0.8) | 0.7 | (± 0.2) |
| i. 17 or older | 0.0 | (± 0.0) | 0.2 | (± 0.1) |
| 210. Smoked a cigarette, even just a puff? | Local
(n = 165) | State
(n = 3,468) |
| a. Never have | 67.3% | (± 7.2%) | 71.2% | (± 2.9%) |
| b. 10 or younger | 5.5 | (± 3.5) | 6.6 | (± 1.3) |
| c. 11 | 2.4 | (± 2.4) | 2.6 | (± 0.7) |
| d. 12 | 4.9 | (± 3.3) | 3.2 | (± 0.8) |
| e. 13 | 4.2 | (± 3.1) | 4.6 | (± 0.9) |
| f. 14 | 5.5 | (± 3.5) | 6.6 | (± 0.8) |
| g. 15 | 8.5 | (± 4.3) | 4.6 | (± 0.7) |
| h. 16 | 1.8 | (± 2.0) | 0.6 | (± 0.2) |
| i. 17 or older | 0.0 | (± 0.0) | 0.2 | (± 0.1) |
| 211. Had more than a sip or two of beer, wine, or hard liquor (for example, vodka, whiskey, or gin)? | Local
(n = 332) | State
(n = 7,033) |
| a. Never have | 43.1% | (± 5.3%) | 43.1% | (± 2.2%) |
| b. 10 or younger | 12.7 | (± 3.6) | 12.0 | (± 0.9) |
| c. 11 | 4.2 | (± 2.2) | 4.8 | (± 0.6) |
| d. 12 | 7.8 | (± 2.9) | 6.2 | (± 0.6) |
| e. 13 | 9.6 | (± 3.2) | 9.4 | (± 0.7) |
| f. 14 | 13.6 | (± 3.7) | 12.6 | (± 1.1) |
| g. 15 | 7.8 | (± 2.9) | 10.5 | (± 0.9) |
| h. 16 | 1.2 | (± 1.2) | 1.0 | (± 0.2) |
| i. 17 or older | 0.0 | (± 0.0) | 0.3 | (± 0.1) |
| 213. Began drinking alcoholic beverages regularly, that is, at least once or twice a month? | Local
(n = 165) | State
(n = 3,454) |
| a. Never have | 76.4% | (± 6.5%) | 76.6% | (± 2.2%) |
| b. 10 or younger | 1.2 | (± 1.7) | 1.7 | (± 0.6) |
| c. 11 | 0.0 | (± 0.0) | 0.9 | (± 0.4) |
| d. 12 | 1.8 | (± 2.0) | 1.4 | (± 0.6) |
| e. 13 | 6.1 | (± 3.6) | 3.3 | (± 0.6) |
| f. 14 | 7.9 | (± 4.1) | 6.8 | (± 1.0) |
| g. 15 | 6.1 | (± 3.6) | 8.1 | (± 1.2) |
| h. 16 | 0.6 | (± 1.2) | 1.1 | (± 0.4) |
| i. 17 or older | 0.0 | (± 0.0) | 0.3 | (± 0.2) |
How old were you when you first:
| 214. Got suspended from school? | Local
(n = 165) | State
(n = 3,464) |
| a. Never have | 74.6% | (± 6.6%) | 74.0% | (± 2.9%) |
| b. 10 or younger | 6.1 | (± 3.6) | 7.4 | (± 1.3) |
| c. 11 | 2.4 | (± 2.4) | 3.4 | (± 0.6) |
| d. 12 | 4.9 | (± 3.3) | 3.2 | (± 0.9) |
| e. 13 | 7.3 | (± 4.0) | 5.3 | (± 1.0) |
| f. 14 | 3.0 | (± 2.6) | 4.3 | (± 0.7) |
| g. 15 | 1.8 | (± 2.0) | 2.2 | (± 0.5) |
| h. 16 | 0.0 | (± 0.0) | 0.2 | (± 0.1) |
| i. 17 or older | 0.0 | (± 0.0) | 0.1 | (± 0.1) |
| 215. Got arrested? | Local
(n = 164) | State
(n = 3,462) |
| a. Never have | 90.2% | (± 4.5%) | 89.4% | (± 2.3%) |
| b. 10 or younger | 0.0 | (± 0.0) | 1.9 | (± 0.6) |
| c. 11 | 0.6 | (± 1.2) | 0.9 | (± 0.5) |
| d. 12 | 1.8 | (± 2.1) | 1.2 | (± 0.5) |
| e. 13 | 1.8 | (± 2.1) | 1.8 | (± 0.5) |
| f. 14 | 4.3 | (± 3.1) | 2.7 | (± 0.7) |
| g. 15 | 1.2 | (± 1.7) | 1.9 | (± 0.5) |
| h. 16 | 0.0 | (± 0.0) | 0.3 | (± 0.2) |
| i. 17 or older | 0.0 | (± 0.0) | 0.0 | (± 0.1) |
| 216. Carried a handgun? | Local
(n = 164) | State
(n = 3,450) |
| a. Never have | 88.4% | (± 4.9%) | 88.8% | (± 1.9%) |
| b. 10 or younger | 6.7 | (± 3.8) | 2.9 | (± 0.6) |
| c. 11 | 0.6 | (± 1.2) | 1.6 | (± 0.6) |
| d. 12 | 0.0 | (± 0.0) | 1.1 | (± 0.6) |
| e. 13 | 0.6 | (± 1.2) | 1.7 | (± 0.3) |
| f. 14 | 2.4 | (± 2.4) | 2.0 | (± 0.4) |
| g. 15 | 1.2 | (± 1.7) | 1.5 | (± 0.4) |
| h. 16 | 0.0 | (± 0.0) | 0.3 | (± 0.2) |
| i. 17 or older | 0.0 | (± 0.0) | 0.2 | (± 0.2) |
| 217. Attacked someone with the idea of seriously hurting them? | Local
(n = 163) | State
(n = 3,442) |
| a. Never have | 80.4% | (± 6.1%) | 81.8% | (± 2.0%) |
| b. 10 or younger | 6.8 | (± 3.8) | 5.0 | (± 1.1) |
| c. 11 | 1.2 | (± 1.7) | 1.6 | (± 0.5) |
| d. 12 | 2.5 | (± 2.4) | 2.2 | (± 0.6) |
| e. 13 | 2.5 | (± 2.4) | 3.1 | (± 0.6) |
| f. 14 | 3.7 | (± 2.9) | 3.4 | (± 0.6) |
| g. 15 | 2.5 | (± 2.4) | 2.3 | (± 0.6) |
| h. 16 | 0.6 | (± 1.2) | 0.6 | (± 0.3) |
| i. 17 or older | 0.0 | (± 0.0) | 0.2 | (± 0.2) |
How wrong do YOU think it is for someone your age to:
| 218. Drink beer, wine, or hard liquor (for example, vodka, whiskey, or gin) regularly? | Local
(n = 165) | State
(n = 3,393) |
| a. Very wrong | 49.1% | (± 7.6%) | 44.4% | (± 2.3%) |
| b. Wrong | 18.8 | (± 6.0) | 26.4 | (± 1.5) |
| c. A little bit wrong | 21.2 | (± 6.2) | 20.1 | (± 2.0) |
| d. Not wrong at all | 10.9 | (± 4.8) | 9.1 | (± 1.3) |
| 219. Smoke cigarettes? | Local
(n = 326) | State
(n = 6,687) |
| a. Very wrong | 58.6% | (± 5.4%) | 58.2% | (± 2.1%) |
| b. Wrong | 21.5 | (± 4.4) | 23.3 | (± 1.3) |
| c. A little bit wrong | 15.0 | (± 3.9) | 12.0 | (± 1.1) |
| d. Not wrong at all | 4.9 | (± 2.4) | 6.5 | (± 0.8) |
| 220. Smoke marijuana? | Local
(n = 164) | State
(n = 3,386) |
| a. Very wrong | 54.3% | (± 7.6%) | 50.4% | (± 2.5%) |
| b. Wrong | 13.4 | (± 5.2) | 19.4 | (± 1.2) |
| c. A little bit wrong | 12.8 | (± 5.1) | 15.2 | (± 1.4) |
| d. Not wrong at all | 19.5 | (± 6.1) | 15.0 | (± 1.5) |
| 221. Use LSD, cocaine, amphetamines, or another illegal drug? | Local
(n = 165) | State
(n = 3,379) |
| a. Very wrong | 81.2% | (± 6.0%) | 78.5% | (± 1.8%) |
| b. Wrong | 10.9 | (± 4.8) | 12.5 | (± 1.3) |
| c. A little bit wrong | 5.5 | (± 3.5) | 5.9 | (± 0.8) |
| d. Not wrong at all | 2.4 | (± 2.4) | 3.1 | (± 0.6) |
| 222. Take a handgun to school? | Local
(n = 165) | State
(n = 3,445) |
| a. Very wrong | 86.1% | (± 5.3%) | 81.7% | (± 1.8%) |
| b. Wrong | 11.5 | (± 4.9) | 13.7 | (± 1.2) |
| c. A little bit wrong | 1.8 | (± 2.0) | 3.1 | (± 0.6) |
| d. Not wrong at all | 0.6 | (± 1.2) | 1.6 | (± 0.5) |
| 223. Steal anything worth more than $5? | Local
(n = 165) | State
(n = 3,432) |
| a. Very wrong | 53.3% | (± 7.6%) | 47.8% | (± 2.3%) |
| b. Wrong | 27.3 | (± 6.8) | 33.9 | (± 1.5) |
| c. A little bit wrong | 15.2 | (± 5.5) | 14.3 | (± 1.5) |
| d. Not wrong at all | 4.2 | (± 3.1) | 4.1 | (± 0.9) |
| 224. Pick a fight with someone? | Local
(n = 165) | State
(n = 3,429) |
| a. Very wrong | 40.6% | (± 7.5%) | 34.5% | (± 2.1%) |
| b. Wrong | 32.7 | (± 7.2) | 36.3 | (± 2.0) |
| c. A little bit wrong | 19.4 | (± 6.0) | 21.8 | (± 1.8) |
| d. Not wrong at all | 7.3 | (± 4.0) | 7.5 | (± 0.9) |
| 225. Attack someone with the idea of seriously hurting them? | Local
(n = 165) | State
(n = 3,426) |
| a. Very wrong | 67.9% | (± 7.1%) | 61.1% | (± 2.3%) |
| b. Wrong | 18.2 | (± 5.9) | 25.6 | (± 1.3) |
| c. A little bit wrong | 12.1 | (± 5.0) | 9.7 | (± 1.4) |
| d. Not wrong at all | 1.8 | (± 2.0) | 3.6 | (± 0.5) |
| 226. Stay away from school all day when their parents think they are at school? | Local
(n = 165) | State
(n = 3,417) |
| a. Very wrong | 43.6% | (± 7.6%) | 41.5% | (± 2.2%) |
| b. Wrong | 37.0 | (± 7.4) | 35.4 | (± 1.7) |
| c. A little bit wrong | 13.9 | (± 5.3) | 17.7 | (± 1.4) |
| d. Not wrong at all | 5.5 | (± 3.5) | 5.4 | (± 0.8) |
| 227. What are the chances you would be seen as cool if you began drinking alcoholic beverages regularly, that is, at least once or twice a month? | Local
(n = 168) | State
(n = 3,537) |
| a. No or very little chance | 37.5% | (± 7.3%) | 34.8% | (± 2.0%) |
| b. Little chance | 25.0 | (± 6.5) | 23.9 | (± 1.1) |
| c. Some chance | 21.4 | (± 6.2) | 22.9 | (± 1.2) |
| d. Pretty good chance | 11.3 | (± 4.8) | 13.5 | (± 1.4) |
| e. Very good chance | 4.8 | (± 3.2) | 5.0 | (± 1.0) |
Think of your four best friends (the friends you feel closest to). In the past year (12 months), how many of your best friends have . . .
| 228. Smoked cigarettes? | Local
(n = 162) | State
(n = 3,310) |
| a. None | 60.5% | (± 7.5%) | 63.4% | (± 3.3%) |
| b. 1 | 18.5 | (± 6.0) | 17.3 | (± 1.5) |
| c. 2 | 9.3 | (± 4.5) | 8.0 | (± 1.2) |
| d. 3 | 5.6 | (± 3.5) | 4.8 | (± 1.0) |
| e. 4 | 6.2 | (± 3.7) | 6.6 | (± 1.2) |
| 229. Tried beer, wine, or hard liquor (for example, vodka, whiskey, or gin) when their parents didn’t know about it? | Local
(n = 162) | State
(n = 3,314) |
| a. None | 46.3% | (± 7.7%) | 42.0% | (± 2.9%) |
| b. 1 | 16.1 | (± 5.6) | 17.1 | (± 1.2) |
| c. 2 | 17.9 | (± 5.9) | 14.2 | (± 1.3) |
| d. 3 | 4.3 | (± 3.1) | 9.7 | (± 1.1) |
| e. 4 | 15.4 | (± 5.6) | 17.1 | (± 1.6) |
| 230. Used marijuana? | Local
(n = 162) | State
(n = 3,308) |
| a. None | 51.2% | (± 7.7%) | 52.5% | (± 2.4%) |
| b. 1 | 15.4 | (± 5.6) | 15.9 | (± 1.1) |
| c. 2 | 11.1 | (± 4.8) | 10.4 | (± 0.9) |
| d. 3 | 7.4 | (± 4.0) | 8.7 | (± 1.0) |
| e. 4 | 14.8 | (± 5.5) | 12.5 | (± 1.0) |
| 231. Used LSD, cocaine, amphetamines, or other illegal drugs? | Local
(n = 162) | State
(n = 3,301) |
| a. None | 85.2% | (± 5.5%) | 83.8% | (± 1.8%) |
| b. 1 | 6.2 | (± 3.7) | 9.3 | (± 1.1) |
| c. 2 | 4.3 | (± 3.1) | 3.3 | (± 0.6) |
| d. 3 | 1.9 | (± 2.1) | 1.4 | (± 0.5) |
| e. 4 | 2.5 | (± 2.4) | 2.2 | (± 0.6) |
| 232. Been suspended from school? | Local
(n = 169) | State
(n = 3,552) |
| a. None of my friends | 66.9% | (± 7.1%) | 67.6% | (± 2.9%) |
| b. 1 of my friends | 21.9 | (± 6.2) | 18.9 | (± 1.5) |
| c. 2 of my friends | 7.7 | (± 4.0) | 7.2 | (± 1.2) |
| d. 3 of my friends | 1.8 | (± 2.0) | 3.4 | (± 0.7) |
| e. 4 of my friends | 1.8 | (± 2.0) | 3.1 | (± 0.7) |
| 233. Carried a handgun? | Local
(n = 169) | State
(n = 3,553) |
| a. None of my friends | 92.3% | (± 4.0%) | 91.1% | (± 1.8%) |
| b. 1 of my friends | 4.7 | (± 3.2) | 5.7 | (± 1.0) |
| c. 2 of my friends | 1.2 | (± 1.6) | 1.5 | (± 0.4) |
| d. 3 of my friends | 0.6 | (± 1.2) | 0.8 | (± 0.4) |
| e. 4 of my friends | 1.2 | (± 1.6) | 0.8 | (± 0.5) |
| 234. Sold illegal drugs? | Local
(n = 168) | State
(n = 3,547) |
| a. None of my friends | 70.2% | (± 6.9%) | 71.7% | (± 1.9%) |
| b. 1 of my friends | 11.9 | (± 4.9) | 14.4 | (± 1.2) |
| c. 2 of my friends | 10.7 | (± 4.7) | 6.4 | (± 0.9) |
| d. 3 of my friends | 3.0 | (± 2.6) | 3.3 | (± 0.6) |
| e. 4 of my friends | 4.2 | (± 3.0) | 4.1 | (± 0.8) |
| 235. Stolen or tried to steal a motor vehicle such as a car or motorcycle? | Local
(n = 169) | State
(n = 3,552) |
| a. None of my friends | 92.3% | (± 4.0%) | 91.0% | (± 1.9%) |
| b. 1 of my friends | 4.1 | (± 3.0) | 5.5 | (± 1.0) |
| c. 2 of my friends | 1.8 | (± 2.0) | 1.6 | (± 0.5) |
| d. 3 of my friends | 1.2 | (± 1.6) | 1.1 | (± 0.6) |
| e. 4 of my friends | 0.6 | (± 1.2) | 0.8 | (± 0.5) |
| 236. Been arrested? | Local
(n = 168) | State
(n = 3,549) |
| a. None of my friends | 83.3% | (± 5.6%) | 79.4% | (± 2.7%) |
| b. 1 of my friends | 8.9 | (± 4.3) | 12.2 | (± 1.3) |
| c. 2 of my friends | 4.8 | (± 3.2) | 4.2 | (± 0.9) |
| d. 3 of my friends | 1.8 | (± 2.0) | 2.1 | (± 0.7) |
| e. 4 of my friends | 1.2 | (± 1.6) | 2.1 | (± 0.6) |
| 237. Dropped out of school? | Local
(n = 167) | State
(n = 3,546) |
| a. None of my friends | 88.0% | (± 4.9%) | 87.6% | (± 2.2%) |
| b. 1 of my friends | 7.8 | (± 4.1) | 7.8 | (± 1.2) |
| c. 2 of my friends | 3.6 | (± 2.8) | 2.5 | (± 0.7) |
| d. 3 of my friends | 0.0 | (± 0.0) | 1.3 | (± 0.6) |
| e. 4 of my friends | 0.6 | (± 1.2) | 0.9 | (± 0.4) |
| 238. When I am an adult I will smoke cigarettes. | Local
(n = 160) | State
(n = 3,301) |
| a. NO! | 64.4% | (± 7.4%) | 71.3% | (± 2.5%) |
| b. no | 25.6 | (± 6.8) | 20.5 | (± 1.7) |
| c. yes | 8.1 | (± 4.2) | 6.2 | (± 1.1) |
| d. YES! | 1.9 | (± 2.1) | 2.0 | (± 0.6) |
| 239. When I am an adult I will drink beer, wine, or liquor. | Local
(n = 160) | State
(n = 3,288) |
| a. NO! | 23.8% | (± 6.6%) | 23.1% | (± 1.9%) |
| b. no | 20.0 | (± 6.2) | 18.0 | (± 1.7) |
| c. yes | 43.1 | (± 7.7) | 45.1 | (± 2.5) |
| d. YES! | 13.1 | (± 5.2) | 13.8 | (± 1.5) |
| 240. When I am an adult I will smoke marijuana. | Local
(n = 159) | State
(n = 3,286) |
| a. NO! | 57.2% | (± 7.7%) | 61.1% | (± 2.6%) |
| b. no | 22.0 | (± 6.4) | 22.0 | (± 1.5) |
| c. yes | 12.6 | (± 5.2) | 10.7 | (± 1.1) |
| d. YES! | 8.2 | (± 4.3) | 6.2 | (± 0.8) |
Think about your four best friends (the friends you feel closest to). In the past year (12 months), how many of your best friends have…
| 241. Participated in clubs, organizations or activities at school? | Local
(n = 163) | State
(n = 3,347) |
| a. None of my friends | 15.3% | (± 5.5%) | 13.2% | (± 2.4%) |
| b. 1 of my friends | 16.6 | (± 5.7) | 13.3 | (± 1.7) |
| c. 2 of my friends | 17.2 | (± 5.8) | 15.5 | (± 1.2) |
| d. 3 of my friends | 15.3 | (± 5.5) | 15.2 | (± 1.6) |
| e. 4 of my friends | 35.6 | (± 7.4) | 42.9 | (± 3.3) |
| 242. Made a commitment to stay drug-free? | Local
(n = 163) | State
(n = 3,329) |
| a. None of my friends | 23.9% | (± 6.5%) | 28.3% | (± 2.3%) |
| b. 1 of my friends | 16.0 | (± 5.6) | 15.6 | (± 1.6) |
| c. 2 of my friends | 11.0 | (± 4.8) | 11.5 | (± 1.1) |
| d. 3 of my friends | 6.1 | (± 3.7) | 11.4 | (± 1.1) |
| e. 4 of my friends | 42.9 | (± 7.6) | 33.2 | (± 2.7) |
| 243. Liked school? | Local
(n = 163) | State
(n = 3,329) |
| a. None of my friends | 21.5% | (± 6.3%) | 26.0% | (± 1.6%) |
| b. 1 of my friends | 14.7 | (± 5.4) | 15.7 | (± 1.6) |
| c. 2 of my friends | 20.9 | (± 6.2) | 18.6 | (± 1.1) |
| d. 3 of my friends | 17.2 | (± 5.8) | 16.9 | (± 1.5) |
| e. 4 of my friends | 25.8 | (± 6.7) | 22.8 | (± 1.7) |
| 244. Regularly attended religious services? | Local
(n = 164) | State
(n = 3,308) |
| a. None of my friends | 32.9% | (± 7.2%) | 28.3% | (± 2.4%) |
| b. 1 of my friends | 21.3 | (± 6.3) | 26.5 | (± 1.5) |
| c. 2 of my friends | 14.6 | (± 5.4) | 21.0 | (± 1.4) |
| d. 3 of my friends | 16.5 | (± 5.7) | 10.9 | (± 1.2) |
| e. 4 of my friends | 14.6 | (± 5.4) | 13.2 | (± 2.1) |
| 245. Tried to do well in school? | Local
(n = 162) | State
(n = 3,317) |
| a. None of my friends | 6.2% | (± 3.7%) | 6.5% | (± 1.6%) |
| b. 1 of my friends | 6.2 | (± 3.7) | 7.2 | (± 1.3) |
| c. 2 of my friends | 12.4 | (± 5.1) | 13.3 | (± 1.5) |
| d. 3 of my friends | 19.1 | (± 6.1) | 17.9 | (± 1.5) |
| e. 4 of my friends | 56.2 | (± 7.6) | 55.1 | (± 3.2) |
| 246. I think it is okay to take something without asking as long as you get away with it. | Local
(n = 170) | State
(n = 3,564) |
| a. NO! | 42.9% | (± 7.4%) | 44.6% | (± 2.2%) |
| b. no | 45.9 | (± 7.5) | 43.2 | (± 1.6) |
| c. yes | 8.2 | (± 4.1) | 9.2 | (± 1.1) |
| d. YES! | 2.9 | (± 2.5) | 3.1 | (± 0.7) |
| 247. I think sometimes it’s okay to cheat at school. | Local
(n = 170) | State
(n = 3,564) |
| a. NO! | 22.9% | (± 6.3%) | 27.3% | (± 2.1%) |
| b. no | 42.4 | (± 7.4) | 38.6 | (± 2.2) |
| c. yes | 28.8 | (± 6.8) | 29.2 | (± 2.4) |
| d. YES! | 5.9 | (± 3.5) | 4.9 | (± 0.7) |
| 248. It is all right to beat up people if they start the fight. | Local
(n = 169) | State
(n = 3,561) |
| a. NO! | 32.0% | (± 7.0%) | 23.3% | (± 2.1%) |
| b. no | 20.7 | (± 6.1) | 25.6 | (± 1.7) |
| c. yes | 25.4 | (± 6.6) | 31.0 | (± 1.6) |
| d. YES! | 21.9 | (± 6.2) | 20.0 | (± 2.6) |
| 249. It is important to be honest with your parents, even if they become upset or you get punished. | Local
(n = 169) | State
(n = 3,553) |
| a. NO! | 9.5% | (± 4.4%) | 7.1% | (± 1.1%) |
| b. no | 11.2 | (± 4.8) | 14.6 | (± 1.2) |
| c. yes | 46.2 | (± 7.5) | 47.5 | (± 1.6) |
| d. YES! | 33.1 | (± 7.1) | 30.7 | (± 1.9) |
| 253. You’re looking at CDs in a music store with a friend. You look up and see her slip a CD under her coat. She smiles and says, “Which one do you want? Go ahead, take it while nobody’s around.” There is nobody in sight, no employees, and no other customers. What would you do now? | Local
(n = 158) | State
(n = 3,253) |
| a. Ignore her | 30.4% | (± 7.2%) | 29.1% | (± 2.4%) |
| b. Grab a CD and leave the store | 10.8 | (± 4.8) | 10.8 | (± 1.5) |
| c. Tell her to put the CD back | 29.8 | (± 7.1) | 32.2 | (± 2.5) |
| d. Act like it’s a joke and ask her to put the CD back | 29.1 | (± 7.1) | 27.9 | (± 2.1) |
| 254. You are visiting another part of town and you don’t know any of the people your age there. You are walking down the street and some teenager you don’t know is walking toward you. He is about your size. As he is about to pass you, he deliberately bumps into you and you almost lose your balance. What would you say or do? | Local
(n = 157) | State
(n = 3,241) |
| a. Push the person back | 16.6% | (± 5.8%) | 14.0% | (± 2.1%) |
| b. Say nothing and keep on walking | 40.8 | (± 7.7) | 45.7 | (± 2.5) |
| c. Say, “Watch where you’re going,” and keep on walking | 31.9 | (± 7.3) | 27.7 | (± 1.3) |
| d. Swear at the person and walk away | 10.8 | (± 4.9) | 12.7 | (± 0.9) |
| 255. You are at a party at someone’s house and one of your friends offers you a drink containing alcohol. What would you say or do? | Local
(n = 157) | State
(n = 3,220) |
| a. Drink it | 33.8% | (± 7.4%) | 33.9% | (± 2.9%) |
| b. Tell your friend, “No thanks. I don’t drink,” and suggest that you and your friend go and do something else | 36.3 | (± 7.5) | 30.4 | (± 2.3) |
| c. Just say, “No, thanks,” and walk away | 24.8 | (± 6.8) | 26.8 | (± 1.9) |
| d. Make up a good excuse, tell your friend you had something else to do, and leave | 5.1 | (± 3.4) | 8.8 | (± 1.0) |
| 256. During the past 12 months, how many days did you miss some school because of a toothache (do not include toothache due to braces or an injury)? (For the elementary version of this question, please see Item 85.) | Local
(n = 166) | State
(n = 3,515) |
| a. None | 95.2% | (± 3.3%) | 92.7% | (± 1.6%) |
| b. 1–4 days | 4.2 | (± 3.1) | 3.8 | (± 0.8) |
| c. 5 days or more | 0.0 | (± 0.0) | 1.4 | (± 0.6) |
| d. Not sure | 0.6 | (± 1.2) | 2.1 | (± 0.5) |
List of Core Items
The core items that appeared on both Forms A and B
(the secondary versions of the survey) are listed below. All other items appeared on either Form A or Form B, but not both. Core items may or may not have appeared on Form C (the elementary version).
Item
| Description | Item
| Description |
1
| Age | 58
| Drinking categories variable |
3
| Gender | 59
| Drunk or high at school (past 12 months) |
4
| Race/Ethnicity | 78
| Participation in after school activities |
5
| Language spoken at home | 97
| 30-day ridden in car with drinking driver |
7
| Mother’s education | 99
| 30-day driven a car while drinking |
8
| Father’s education | 102
| Weapon carrying on school property (past 30 days) |
14
| Honesty in completing survey | 103
| Physical fighting (past 12 months) |
16
| Lifetime alcohol use | 105
| Gang membership |
17
| Lifetime marijuana use | 110
| Depression (past 12 months) |
24
| 30-day use of cigarettes | 111
| Seriously consider attempting suicide |
25
| 30-day use of chewing tobacco | 122
| Been bullied (past 30 days) |
28
| 30-day use of alcohol | 131
| School provides counselor to discuss ATOD |
29
| 30-day use of marijuana or hashish | 186
| Grades in school (past 12 months) |
30/31
| 30-day use of illegal drugs | 191
| Enjoyed being in school (past 12 months) |
32
| 30-day use of painkillers | 202
| Feel safe at school |
34
| Would smoke if offered cigarette by a friend | 208
| Age when first smoked marijuana |
35
| Intent to smoke within the next year | 211
| Age when first drank alcohol |
55
| Binge drinking | 219
| Perceived wrongness of smoking |
Item Index
| Age at first use 208, 210, 211, 213
Alcohol Age at first use 211, 213 Attitudes 56–57, 156, 158, 218, 227, 239, 255 Driving 97, 99 Prevention 50–52 Quitting 62 Source 60, 150 Use 28, 55, 58–59, 229 Arrest 215, 236 Asthma 79–84 Bullying 122–130 Clubs 162–164 Cocaine (see Drugs) Demographics 1, 3–5, 7–8 Dental Health 88, 256 Depression 110, 116 Diabetes 86 Drugs Age at first use 208 Cocaine 21, 153, 221, 231 Marijuana 17, 29, 54, 152, 155, 160, 208, 220, 230, 240 Methamphetamines 20, 153, 221, 231 Other drugs 18–19, 22, 30–33, 221, 231 Quitting 62 Selling 234 Source 61, 153 | Family 143–145, 168–185
Fighting 103–104, 217, 224–225, 248, 254 Fitness Body weight 63–64 Exercise 71–73 Physical Education 76–77 Friends 228–237, 241–245 Gambling 120–121 Gangs 105 Guns (see Weapons) HIV/AIDS Education 133–135 Honesty 14, 246–247, 249 Marijuana (see Drugs) Medical care 87–88 Methamphetamines (see Drugs) Neighborhood 147–149, 161 Nutrition 65–70 Pregnancy prevention 134–135 Quality of life 136–142 Risk of harm 37, 54, 204–207 Rules enforcement 53, 132, 168–175 Safety 93, 95–96 School Absence 194, 226 Achievement 186–187, 193 After school activities 78 ATOD Intervention 131 | School (continued)
Climate 195–201, 203 Enjoyment 191–192 Fighting at 104 Safety 202 Schoolwork 188-190, 197 Substance use at 40, 59 Suspension 214, 232 Weapons at 102, 222 Sexual Behavior 89–92 Sleep 12–13 Suicide 111–113, 117–119 Teams (see Clubs) Theft 223, 235, 253 Tobacco Advertising 42 Age at first use 210 Chewing 25 Cigarettes 15, 24, 34–37, 40, 157, 210, 219, 228, 238 Prevention 38–39, 48 Quitting 62 Secondhand smoke 41, 43–45, 47 Source 49, 151 Other tobacco use 26–27 TV/Video Games 74–75 Weapons 100, 102, 154, 159, 216, 233 Violence 106–109 Work 9–11 |