
Contents
| Introduction and Overview | 1 |
| Key to the Notes | 1 | |
| Highlights of the Local Results | 2 | |
| Selected Results by Gender | 3 | |
| General Information (Items 1–14) | 4 |
| Alcohol, Tobacco, and Other Drug (ATOD) Use | 5 |
| Lifetime Use (Items 15-23) | 5 | |
| 30-Day Use (Items 24–33) | 5 | |
| Other Tobacco-Related Questions (Items 34–49) | 6 | |
| Other Alcohol- and Drug-Related Questions (Items 50-62) | 8 | |
| Other Health Concerns | 9 |
| Nutrition and Fitness (Items 63-78) | 9 | |
| Health Conditions and Health Care (Items 79–88) | 10 | |
| Sexual Behavior (Items 89–92) | 10 | |
| Safety (Items 93–99) | 11 | |
| Behaviors Related to Intentional Injuries (Items 100–109) | 11 | |
| Depression (Items 110–119) | 12 | |
| Gambling (Items 120–121) | 12 | |
| School Climate (Items 122–135) | 12 |
| Quality of Life (Items 136–146) | 12 |
| Risk and Protective Factors | 13 |
| Risk and Protective Factor Framework and Reporting Schedule | 14 | |
| Risk and Protective Factor Scale Results | 15 | |
| Graph of Scale Results | 16 | |
| Risk and Protective Factors: Individual Item Results | 17 |
| Community Domain (Items 147–167) | 17 | |
| Family Domain (Items 168–185) | 19 | |
| School Domain (Items 186–203) | 20 | |
| Peer and Individual Domain (Items 204–256) | 22 | |
| Item Index | 25 |
Healthy Youth Survey 2010
Survey Results
Evergreen Middle School (Everett School District), Grade 6
| Number of students surveyed: | 288 |
| Number of valid responses: | 277 |
| Estimate of enrolled students:* | 349 |
| Survey participation rate:** | 79% |
| · 70% or greater participation–Results are probably representative of students in this grade. | |
| · 40–69% participation–Results may be representative of students in this grade. | |
| · Less than 40% participation–Results are likely not representative of students in this grade but do reflect students who completed the survey. |
Key to the Notes
The survey was administered in 4 versions: Forms A and B (or alternate Form NS, identical to Form B but without the sexual behavior questions) were administered to students in Grades 8, 10, and 12. Forms A and B (or NS) contained a core set of common items (see “List of Core Items” on the last page of this report) and additional items unique to each form. Form C was administered to students in Grade 6. This form consisted primarily of items drawn from Forms A and B but also included some unique items. Several items on each form were optional at the discretion of the school; schools that did not administer the optional items tore off the last page of the survey booklet. The following notes are used throughout this report to document the differences between the items on different versions and indicate the optional items:
A = wording on Form A
B = wording on Form B (and NS)
C = wording on Form C
† = optional item
* Estimate of enrolled students based on figures from the 2008–2009 school year, provided by OSPI (or later if school not in 2008 enrollment file).
** Participation rate = valid responses ÷ enrolled students (may be >100% if enrollment greater in 2010 than 2008).
Evergreen Middle School (Everett School District) Grade 6
Highlights of the Local Results
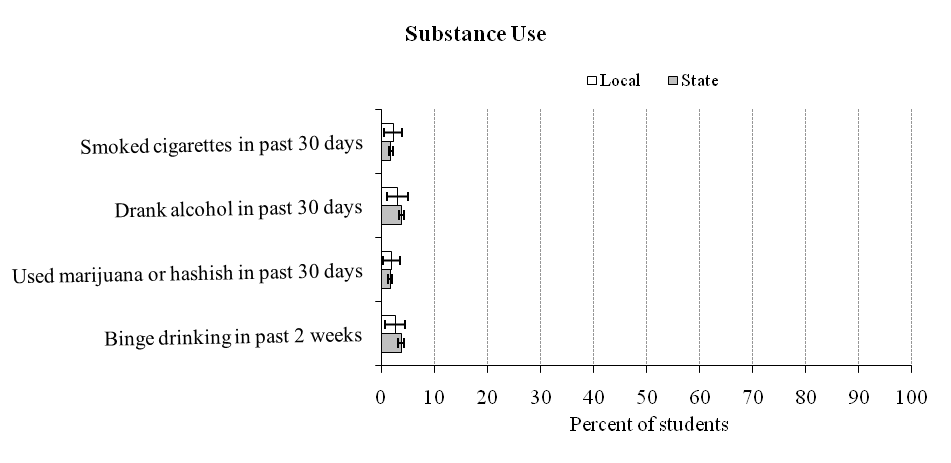
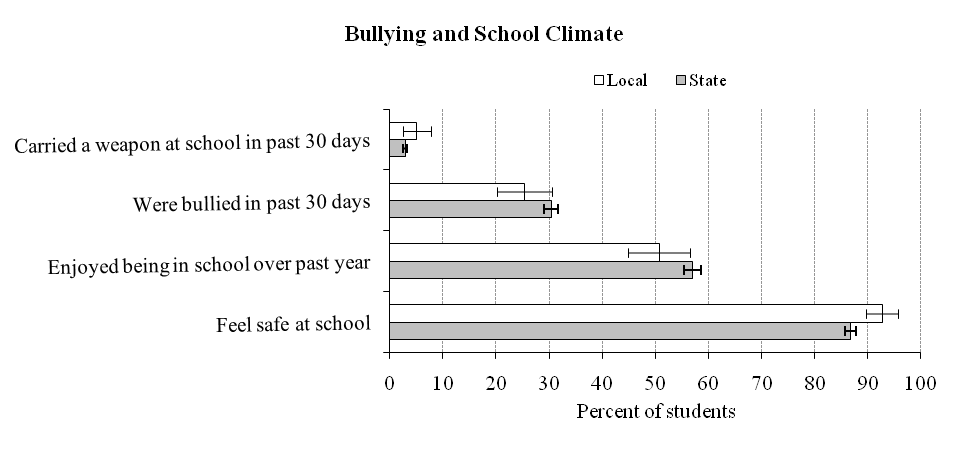
Your students and students statewide reported the following behaviors and attitudes:
Your students | Statewide
|
| § Smoking cigarettes in the past 30 days (see item 24). | 2.2% | (± 1.7%) | 1.7% | (± 0.4%) |
| Drinking alcohol in the past 30 days (see item 28). | 2.9 | (± 2.0) | 3.8 | (± 0.5) |
| Using marijuana or hashish in the past 30 days (see item 29). | 1.8 | (± 1.6) | 1.6 | (± 0.4) |
| Drinking five or more drinks in a row in the past 2 weeks (see Item 55). | 2.6 | (± 1.9) | 3.7 | (± 0.6) |
| Carrying a weapon at school in the past 30 days (see item 101). | 5.1 | (± 2.6) | 2.9 | (± 0.4) |
| Being bullied in the past 30 days (see item 122). | 25.4 | (± 5.2) | 30.4 | (± 1.4) |
| Enjoyed being in school over the past year (see item 191). | 50.7 | (± 5.9) | 57.1 | (± 1.6) |
| Feeling safe at school (see item 202). | 92.8 | (± 3.1) | 86.8 | (± 1.1) |


Selected Results by Gender
Selected items are presented by gender to highlight any differences between females and males. The p-values reported after each item can be used to examine whether differences in the local data between females and males are statistically significant. A p-value of less than .05 means, for the local results, there is a significant difference between females and males (i.e., the probability that the difference occurred by chance is less than 5%). To ensure student anonymity, local results are suppressed for each item on this page if any cell (e.g., females who reported smoking) represented fewer than 10 students.
| During the past 30 days, on how many days did you smoke cigarettes? (See item 24.) | Local
(n = *) | State
(n = 11,129) |
Female
| Male
| Female
| Male
| |
| None | *.*% | *.*% | 98.6% | 97.9% |
| 1 or more | *.* | *.* | 1.4 | 2.1 |
| During the past 30 days, on how many days did you drink a glass, can or bottle of alcohol (beer, wine, wine coolers, hard liquor)? (See item 28.) | Local
(n = *) | State
(n = 11,072) |
Female
| Male
| Female
| Male
| |
| None | *.*% | *.*% | 97.0% | 95.5% |
| 1 or more | *.* | *.* | 3.0 | 4.5 |
| Think back over the last 2 weeks. How many times have you had five or more drinks in a row? (A drink is a glass of wine, a bottle of beer, a shot glass of liquor, or a mixed drink.) (See item 55.) | Local
(n = *) | State
(n = 10,854) |
Female
| Male
| Female
| Male
| |
| None | *.*% | *.*% | 97.3% | 95.4% |
| Once or more | *.* | *.* | 2.8 | 4.6 |
| During the past l2 months, did you ever feel so sad or hopeless almost every day for two weeks or more in a row that you stopped doing some usual activities? (See item 110.) | [Only on the secondary version of the survey.]
|
| In the last 30 days, how often have you been bullied? (See item 122.) | Local
(n = 271) | State
(n = 10,826) |
Female
| Male
| Female
| Male
| |
| I have not been bullied | 77.5% | 71.3% | 69.9% | 69.3% |
| Once or more | 22.5 | 28.7 | 30.1 | 30.7 |
| I feel safe at my school. (See item 202.) | Local
(n = *) | State
(n = 11,323) |
Female
| Male
| Female
| Male
| |
| No | *.*% | *.*% | 10.5% | 16.0% |
| Yes | *.* | *.* | 89.5 | 84.0 |
General Information
[Item 1 appears only on the secondary version of the survey.]
| 2. How old are you? | Local
(n = 276) | State
(n = 11,523) |
| a. 10 or younger | 1.5% | (± 1.4%) | 2.1% | (± 0.3%) |
| b. 11 | 76.8 | (± 5.0) | 72.7 | (± 1.4) |
| c. 12 | 21.7 | (± 4.9) | 24.3 | (± 1.3) |
| d. 13 | 0.0 | (± 0.0) | 0.8 | (± 0.2) |
| e. 14 | 0.0 | (± 0.0) | 0.1 | (± 0.1) |
| f. 15 or older | 0.0 | (± 0.0) | 0.0 | (± 0.0) |
| 3. Are you: | Local
(n = 276) | State
(n = 11,512) |
| a. Female | 52.2% | (± 5.9%) | 50.3% | (± 0.9%) |
| b. Male | 47.8 | (± 5.9) | 49.7 | (± 0.9) |
| 4. How do you describe yourself? (Select one or more responses.) | Local
(n = 273) | State
(n = 11,201) |
| a. American Indian or Alaskan Native | 9.2% | (± 3.4%) | 8.9% | (± 2.3%) |
| b. Asian or Asian American | 2.9 | (± 2.0) | 4.8 | (± 0.8) |
| c. Black or African-American | 5.9 | (± 2.8) | 5.6 | (± 1.5) |
| d. Hispanic or Latino/Latina | 15.4 | (± 4.3) | 14.9 | (± 3.6) |
| e. Native Hawaiian or other Pacific Islander | 0.0 | (± 0.0) | 1.8 | (± 0.4) |
| f. White or Caucasian | 47.6 | (± 5.9) | 37.6 | (± 4.4) |
| g. Other | 8.8 | (± 3.4) | 14.5 | (± 1.1) |
| More than one race/ethnicity marked | 10.3 | (± 3.6) | 12.0 | (± 1.1) |
| 6. What language is usually spoken in the home? | Local
(n = 275) | State
(n = 11,412) |
| a. English | 77.8% | (± 4.9%) | 80.5% | (± 4.1%) |
| b. Spanish | 14.2 | (± 4.1) | 12.0 | (± 3.7) |
| c. Other | 8.0 | (± 3.2) | 7.5 | (± 2.0) |
| 14. How honest were you in filling out this survey? | Local
(n = 269) | State
(n = 10,099) |
| a. I was very honest | 87.0% | (± 4.0%) | 89.6% | (± 1.0%) |
| b. I was honest pretty much of the time | 11.9 | (± 3.9) | 9.0 | (± 0.9) |
| c. I was honest some of the time | 1.1 | (± 1.3) | 1.5 | (± 0.3) |
| d. I was honest once in a while | Surveys pulled
|
| e. I was not honest at all | Surveys pulled
|
Alcohol, Tobacco, and Other Drug Use
Alcohol, tobacco, and other drug use has been a major concern in this country for many years. The consequences of ATOD use are well known. In the short term, ATOD use interferes with positive physical, emotional, and social development. In the long term, ATOD use is associated with delinquency and criminal activity, unintended injuries, and a variety of health complications including shorter life expectancy. The economic costs of ATOD use are enormous (in Washington State an estimated $1.81 billion in 1990, $2.54 billion in 1996, and $5.21 billion in 2005). Tobacco use is the world’s leading cause of preventable death, disease, and disability. This section provides information about lifetime ATOD use (which in part reflects experimental use), use in the past 30 days (i.e., current use), and other tobacco-, alcohol-, and drug-related issues.
Lifetime Use
[Item 15 appears only on the secondary version of the survey.]
| 16. Have you ever had more than a sip or two of beer, wine, or hard liquor (for example, vodka, whiskey, or gin)? (Computed from item 211 or 212.) | Local
(n = 273) | State
(n = 10,970) |
| a. No | 75.8% | (± 5.1%) | 73.7% | (± 1.2%) |
| b. Yes | 24.2 | (± 5.1) | 26.3 | (± 1.2) |
| 17. Have you ever smoked marijuana? (Computed from item 208 or 209.) | Local
(n = 273) | State
(n = 10,982) |
| a. No | 94.9% | (± 2.6%) | 96.1% | (± 0.6%) |
| b. Yes | 5.1 | (± 2.6) | 3.9 | (± 0.6) |
| 18. Have you ever, even once in your lifetime, used inhalants (things you sniff to get high)? | Local
(n = 274) | State
(n = 10,957) |
| a. Yes | 96.0% | (± 2.3%) | 96.5% | (± 0.5%) |
| b. No | 4.0 | (± 2.3) | 3.5 | (± 0.5) |
| 23. Have you ever, even once in your lifetime, used other illegal drugs? | Local
(n = 273) | State
(n = 10,943) |
| a. Yes | 97.1% | (± 2.0%) | 97.7% | (± 0.4%) |
| b. No | 2.9 | (± 2.0) | 2.3 | (± 0.4) |
30-Day Use (Use in the Past 30 Days)
During the past 30 days, on how many days did you:
| 24. Smoke cigarettes? | Local
(n = 275) | State
(n = 11,161) |
| a. None | 97.8% | (± 1.7%) | 98.3% | (± 0.4%) |
| b. 1–2 days | 1.5 | (± 1.4) | 1.1 | (± 0.2) |
| c. 3–5 days | 0.7 | (± 1.0) | 0.2 | (± 0.1) |
| d. 6–9 days | 0.0 | (± 0.0) | 0.1 | (± 0.1) |
| e. 10–29 days | 0.0 | (± 0.0) | 0.1 | (± 0.1) |
| f. All 30 days | 0.0 | (± 0.0) | 0.2 | (± 0.1) |
| Any use in past 30 days | 2.2 | (± 1.7) | 1.7 | (± 0.4) |
| 25. Use chewing tobacco, snuff, or dip? | Local
(n = 275) | State
(n = 11,108) |
| a. None | 98.9% | (± 1.2%) | 99.0% | (± 0.3%) |
| b. 1–2 days | 0.7 | (± 1.0) | 0.7 | (± 0.2) |
| c. 3–5 days | 0.4 | (± 0.7) | 0.2 | (± 0.1) |
| d. 6–9 days | 0.0 | (± 0.0) | 0.1 | (± 0.0) |
| e. 10–29 days | 0.0 | (± 0.0) | 0.1 | (± 0.0) |
| f. All 30 days | 0.0 | (± 0.0) | 0.1 | (± 0.1) |
| Any use in past 30 days | 1.1 | (± 1.2) | 1.0 | (± 0.3) |
| 28. Drink a glass, can or bottle of alcohol (beer, wine, wine coolers, hard liquor)? | Local
(n = 274) | State
(n = 11,103) |
| a. None | 97.1% | (± 2.0%) | 96.2% | (± 0.5%) |
| b. 1–2 days | 1.1 | (± 1.2) | 2.7 | (± 0.3) |
| c. 3–5 days | 1.1 | (± 1.2) | 0.5 | (± 0.2) |
| d. 6–9 days | 0.4 | (± 0.7) | 0.2 | (± 0.1) |
| e. 10 or more days | 0.4 | (± 0.7) | 0.3 | (± 0.1) |
| Any use in past 30 days | 2.9 | (± 2.0) | 3.8 | (± 0.5) |
| 29. Use marijuana or hashish (grass, hash, pot)? | Local
(n = 275) | State
(n = 11,067) |
| a. None | 98.2% | (± 1.6%) | 98.4% | (± 0.4%) |
| b. 1–2 days | 0.4 | (± 0.7) | 0.8 | (± 0.2) |
| c. 3–5 days | 0.0 | (± 0.0) | 0.3 | (± 0.1) |
| d. 6–9 days | 0.4 | (± 0.7) | 0.3 | (± 0.1) |
| e. 10 or more days | 1.1 | (± 1.2) | 0.3 | (± 0.1) |
| Any use in past 30 days | 1.8 | (± 1.6) | 1.6 | (± 0.4) |
| 30. Not counting alcohol, tobacco, or marijuana, use another illegal drug? | Local
(n = 275) | State
(n = 11,018) |
| a. None | 98.6% | (± 1.4%) | 99.1% | (± 0.2%) |
| b. 1–2 days | 0.7 | (± 1.0) | 0.4 | (± 0.1) |
| c. 3–5 days | 0.4 | (± 0.7) | 0.2 | (± 0.1) |
| d. 6–9 days | 0.4 | (± 0.7) | 0.1 | (± 0.0) |
| e. 10 or more days | 0.0 | (± 0.0) | 0.3 | (± 0.1) |
| Any use in past 30 days | 1.5 | (± 1.4) | 0.9 | (± 0.2) |
| 31. Use any illegal drug, including marijuana? (Computed from items 29 and 30.) | Local
(n = 275) | State
(n = 10,988) |
| None | 97.5% | (± 1.9%) | 98.0% | (± 0.4%) |
| 1 or more | 2.6 | (± 1.9) | 2.0 | (± 0.4) |
| Any use in the past 30 days | 2.6 | (± 1.9) | 2.0 | (± 0.4) |
Other Tobacco-Related Questions
| 34. If one of your best friends offered you a cigarette, would you smoke it? | Local
(n = 274) | State
(n = 10,763) |
| a. Definitely no | 89.8% | (± 3.6%) | 89.4% | (± 1.1%) |
| b. Probably no | 6.9 | (± 3.0) | 7.4 | (± 0.7) |
| c. Probably yes | 2.2 | (± 1.7) | 2.3 | (± 0.5) |
| d. Definitely yes | 1.1 | (± 1.2) | 0.8 | (± 0.2) |
| 35. Do you think that you will smoke a cigarette anytime in the next year? | Local
(n = 274) | State
(n = 10,727) |
| a. Definitely no | 88.7% | (± 3.7%) | 88.7% | (± 1.2%) |
| b. Probably no | 9.1 | (± 3.4) | 8.1 | (± 0.8) |
| c. Probably yes | 2.2 | (± 1.7) | 2.3 | (± 0.4) |
| d. Definitely yes | 0.0 | (± 0.0) | 0.9 | (± 0.2) |
| 36. Have made a firm commitment to not smoke cigarettes; i.e., not susceptible to smoking. (Computed from both items 34 and 35). | Local
(n = 274) | State
(n = 10,726) |
| a. Yes, not susceptible | 85.8% | (± 4.1%) | 85.6% | (± 1.3%) |
| b. No, susceptible | 14.2 | (± 4.1) | 14.4 | (± 1.3) |
| 37. Do you think young people risk harming themselves if they smoke 1–5 cigarettes a day? | Local
(n = 273) | State
(n = 10,309) |
| a. Definitely no | 8.4% | (± 3.3%) | 7.7% | (± 1.0%) |
| b. Probably no | 4.0 | (± 2.3) | 5.2 | (± 0.5) |
| c. Probably yes | 24.9 | (± 5.1) | 26.3 | (± 0.9) |
| d. Definitely yes | 62.6 | (± 5.7) | 60.8 | (± 1.5) |
| 38. During the past year in school, how many times did you get information in classes about the dangers of tobacco use? | Local
(n = 274) | State
(n = 11,312) |
| a. None | 23.0% | (± 5.0%) | 24.2% | (± 2.2%) |
| b. Once | 16.1 | (± 4.4) | 19.6 | (± 1.3) |
| c. 2 or 3 times | 31.0 | (± 5.5) | 31.3 | (± 1.5) |
| d. 4 or more times | 29.9 | (± 5.4) | 25.0 | (± 2.5) |
| 41. Do you think the smoke from other people’s cigarettes (secondhand smoke) is harmful to you? | Local
(n = 267) | State
(n = 10,045) |
| a. Definitely no | 4.9% | (± 2.6%) | 6.6% | (± 0.9%) |
| b. Probably no | 7.5 | (± 3.2) | 6.2 | (± 0.6) |
| c. Probably yes | 22.9 | (± 5.0) | 30.3 | (± 1.4) |
| d. Definitely yes | 64.8 | (± 5.7) | 56.9 | (± 1.7) |
| 43. During the past 7 days, on how many days were you in the same room with someone who was smoking cigarettes? | Local
(n = 266) | State
(n = 10,116) |
| a. 0 days | 72.6% | (± 5.4%) | 76.4% | (± 1.6%) |
| b. 1–2 days | 12.4 | (± 4.0) | 11.8 | (± 0.7) |
| c. 3–4 days | 6.0 | (± 2.9) | 4.1 | (± 0.5) |
| d. 5–6 days | 1.9 | (± 1.6) | 1.6 | (± 0.3) |
| e. 7 days | 7.1 | (± 3.1) | 6.1 | (± 0.7) |
| 45. During the past 7 days, on how many days did you ride in a car with someone who was smoking cigarettes? | Local
(n = 267) | State
(n = 10,075) |
| a. 0 days | 76.8% | (± 5.1%) | 80.0% | (± 2.0%) |
| b. 1-2 days | 7.9 | (± 3.2) | 8.9 | (± 1.0) |
| c. 3-4 days | 5.2 | (± 2.7) | 4.1 | (± 0.5) |
| d. 5-6 days | 3.4 | (± 2.2) | 2.1 | (± 0.4) |
| e. 7 days | 6.7 | (± 3.0) | 4.9 | (± 0.6) |
| 46. Has either of your parents (or guardians) discussed the dangers of tobacco use with you? | Local
(n = 268) | State
(n = 10,111) |
| a. Mother (or female guardian) only | 11.9% | (± 3.9%) | 14.9% | (± 0.9%) |
| b. Father (or male guardian) only | 3.7 | (± 2.3) | 4.1 | (± 0.4) |
| c. Both | 57.8 | (± 5.9) | 59.5 | (± 1.5) |
| d. Neither | 26.5 | (± 5.3) | 21.5 | (± 1.1) |
Other Alcohol- and Drug-Related Questions
[Items 50–51 appear only on the secondary version of the survey.]
| 52. During the past year in school, how many times did you get information in classes about reasons not to use alcohol and other drugs? | Local
(n = 272) | State
(n = 10,229) |
| a. None | 17.3% | (± 4.5%) | 19.4% | (± 1.7%) |
| b. Once | 18.0 | (± 4.6) | 17.9 | (± 1.3) |
| c. 2 or 3 times | 26.1 | (± 5.2) | 30.2 | (± 1.3) |
| d. 4 or more times | 38.6 | (± 5.8) | 32.5 | (± 2.3) |
| 55. Think back over the last 2 weeks. How many times have you had five or more drinks in a row? (A drink is a glass of wine, a bottle of beer, a shot glass of liquor, or a mixed drink.) | Local
(n = 274) | State
(n = 10,883) |
| a. None | 97.5% | (± 1.9%) | 96.4% | (± 0.6%) |
| b. Once | 1.1 | (± 1.2) | 2.2 | (± 0.3) |
| c. Twice | 0.4 | (± 0.7) | 0.7 | (± 0.2) |
| d. 3–5 times | 0.7 | (± 1.0) | 0.3 | (± 0.1) |
| e. 6–9 times | 0.0 | (± 0.0) | 0.1 | (± 0.1) |
| f. 10 or more times | 0.4 | (± 0.7) | 0.3 | (± 0.1) |
| 58. Drinking Categories Variable (Computed from items 28 and 55). | Local
(n = 273) | State
(n = 10,850) |
| a. No alcohol use | 96.3% | (± 2.2%) | 94.3% | (± 0.7%) |
| b. 1-2 days and no binges | 0.4 | (± 0.7) | 1.7 | (± 0.2) |
| c. 3-5 days or 1 binge | 1.5 | (± 1.4) | 2.4 | (± 0.4) |
| d. 6+ days or 2+ binges | 1.8 | (± 1.6) | 1.6 | (± 0.4) |
Other Health Concerns
This section provides results regarding other health concerns including nutrition and fitness, health conditions and health care, safety, behaviors related to intentional injury, depression, and gambling behavior. Proper nutrition and exercise are critical components of a healthy life, as is access to preventive health care. Safety-related behaviors, such as wearing a seat belt when in a moving vehicle, can profoundly influence the outcome of an accident. Injury is the leading cause of death for adolescents aged 10 to 19, and violence contributes to injury-related deaths. People who are depressed experience a range of symptoms, and depression is associated with suicidal behavior.
Nutrition and Fitness
[Items 63–64 appear only on the secondary version of the survey.]
| 65. How often do you eat dinner with your family?† | Local
(n = 266) | State
(n = 8,866) |
| a. Never | 4.9% | (± 2.6%) | 3.2% | (± 0.5%) |
| b. Rarely | 8.7 | (± 3.4) | 8.9 | (± 0.9) |
| c. Sometimes | 14.3 | (± 4.2) | 12.4 | (± 0.9) |
| d. Most of the time | 26.3 | (± 5.3) | 30.8 | (± 1.3) |
| e. Always | 45.9 | (± 6.0) | 44.7 | (± 1.5) |
| 67. Did you eat breakfast today? | Local
(n = 270) | State
(n = 10,246) |
| a. Yes | 64.8% | (± 5.7%) | 77.2% | (± 1.9%) |
| b. No | 35.2 | (± 5.7) | 22.8 | (± 1.9) |
| 68. How many sodas or pops did you drink yesterday? (Do not count diet soda.) | Local
(n = 269) | State
(n = 10,199) |
| a. None | 61.0% | (± 5.8%) | 65.2% | (± 2.0%) |
| b. 1 | 27.9 | (± 5.4) | 24.2 | (± 1.2) |
| c. 2 | 7.1 | (± 3.1) | 6.0 | (± 0.7) |
| d. 3 | 2.6 | (± 1.9) | 2.0 | (± 0.3) |
| e. 4 or more | 1.5 | (± 1.5) | 2.6 | (± 0.5) |
On how many of the past 7 days did you:
| 71. In the past 7 days, on how many days were you physically active for a total of at least 60 minutes per day? (Add up all the time you spent in any kind of physical activity that increases your heart rate or makes you breathe hard some of the time.) | Local
(n = 274) | State
(n = 11,242) |
| a. 0 days | 5.8% | (± 2.8%) | 5.4% | (± 0.6%) |
| b. 1 day | 9.1 | (± 3.4) | 4.9 | (± 0.4) |
| c. 2 days | 12.4 | (± 3.9) | 7.4 | (± 0.6) |
| d. 3 days | 11.7 | (± 3.8) | 11.1 | (± 0.8) |
| e. 4 days | 15.0 | (± 4.2) | 12.8 | (± 0.8) |
| f. 5 days | 16.4 | (± 4.4) | 17.6 | (± 0.8) |
| g. 6 days | 11.7 | (± 3.8) | 12.2 | (± 1.1) |
| h. 7 days | 17.9 | (± 4.5) | 28.7 | (± 1.2) |
| 72. On average how many days a week do you walk to or from school? | Local
(n = 276) | State
(n = 11,505) |
| a. Never | 64.9% | (± 5.6%) | 64.8% | (± 4.5%) |
| b. 1–2 | 12.3 | (± 3.9) | 10.3 | (± 1.1) |
| c. 3–4 | 5.8 | (± 2.8) | 6.4 | (± 1.0) |
| d. I walk every day | 17.0 | (± 4.4) | 18.5 | (± 3.0) |
| 73. On average how many days a week do you ride a bicycle to or from school? | Local
(n = 277) | State
(n = 11,499) |
| a. Never | 97.5% | (± 1.8%) | 91.9% | (± 1.1%) |
| b. 1–2 | 1.1 | (± 1.2) | 4.3 | (± 0.6) |
| c. 3–4 | 0.4 | (± 0.7) | 1.8 | (± 0.3) |
| d. I bike every day | 1.1 | (± 1.2) | 2.0 | (± 0.5) |
Health Conditions and Health Care
| 79. Has a doctor or nurse ever told you that you have asthma? | Local
(n = 277) | State
(n = 11,481) |
| a. Yes | 17.0% | (± 4.4%) | 14.4% | (± 0.8%) |
| b. No | 74.7 | (± 5.1) | 75.9 | (± 0.9) |
| c. Not sure | 8.3 | (± 3.3) | 9.7 | (± 0.5) |
| 80. Do you still have asthma? | Local
(n = 274) | State
(n = 11,455) |
| a. I have never had asthma | 67.5% | (± 5.5%) | 68.9% | (± 1.1%) |
| b. Yes | 9.9 | (± 3.5) | 10.3 | (± 0.7) |
| c. No | 10.6 | (± 3.6) | 11.0 | (± 0.7) |
| d. Not sure | 12.0 | (± 3.9) | 9.8 | (± 0.5) |
| 85. During the past year, did you miss any time from school because of a toothache (do not include toothache due to braces or an injury)? (For the secondary version of this question, please see Item 256.) | Local
(n = 276) | State
(n = 11,439) |
| a. Yes | 5.8% | (± 2.8%) | 8.4% | (± 0.8%) |
| b. No | 85.9 | (± 4.1) | 81.8 | (± 1.4) |
| c. Not sure | 8.3 | (± 3.3) | 9.8 | (± 0.8) |
Sexual Behavior
[Items 89–92 appear only on the secondary version of the survey.]
Evergreen Middle School (Everett School District) Grade 6
Safety
[Item 93 appears only on the secondary version of the survey.]
| 94. When you ride a bicycle, how often do you wear a helmet? | Local
(n = 277) | State
(n = 11,504) |
| a. I do not ride a bicycle | 13.7% | (± 4.1%) | 11.5% | (± 1.2%) |
| b. Never wear a helmet | 24.2 | (± 5.0) | 22.6 | (± 3.2) |
| c. Rarely wear a helmet | 11.2 | (± 3.7) | 13.2 | (± 1.2) |
| d. Sometimes wear a helmet | 10.1 | (± 3.5) | 13.4 | (± 0.9) |
| e. Most of the time wear a helmet | 19.5 | (± 4.7) | 15.4 | (± 1.5) |
| f. Always wear a helmet | 21.3 | (± 4.8) | 23.9 | (± 3.2) |
| 96. How often do you wear a seat belt when riding in a car (driven by someone else) B? | Local
(n = 277) | State
(n = 11,512) |
| a. Never | 0.0% | (± 0.0%) | 0.8% | (± 0.2%) |
| b. Rarely | 1.8 | (± 1.6) | 1.2 | (± 0.2) |
| c. Sometimes | 1.8 | (± 1.6) | 3.2 | (± 0.5) |
| d. Most of the time | 10.1 | (± 3.5) | 13.5 | (± 0.8) |
| e. Always | 86.3 | (± 4.1) | 81.3 | (± 1.2) |
| 98. Have you ever ridden in a car driven by someone who had been drinking alcohol? | Local
(n = 273) | State
(n = 10,292) |
| a. Yes | 22.0% | (± 4.9%) | 19.5% | (± 1.5%) |
| b. No | 58.6 | (± 5.8) | 62.6 | (± 1.3) |
| c. Not sure | 19.4 | (± 4.7) | 17.9 | (± 0.9) |
Behaviors Related to Intentional Injuries
[Item 100 appears only on the secondary version of the survey.]
| 101. During the past 30 days, did you carry a weapon such as a gun, knife, or club on school property? | Local
(n = 275) | State
(n = 10,986) |
| a. Yes | 5.1% | (± 2.6%) | 2.9% | (± 0.4%) |
| b. No | 94.9 | (± 2.6) | 97.1 | (± 0.4) |
[Item 102 appears only on the secondary version of the survey.]
| 103. During the past 12 months, how many times were you in a physical fight? | Local
(n = 272) | State
(n = 10,816) |
| a. 0 times | 71.3% | (± 5.4%) | 70.7% | (± 1.4%) |
| b. 1 time | 13.2 | (± 4.0) | 13.3 | (± 0.8) |
| c. 2–3 times | 7.0 | (± 3.0) | 8.3 | (± 0.6) |
| d. 4–5 times | 1.5 | (± 1.4) | 2.5 | (± 0.3) |
| e. 6 or more times | 7.0 | (± 3.0) | 5.3 | (± 0.5) |
Depression
[Items 110–113 appear only on the secondary version of the survey.]
| 114. Have you ever seriously thought about killing yourself? | Local
(n = 272) | State
(n = 10,796) |
| a. Yes | 14.3% | (± 4.2%) | 14.0% | (± 1.1%) |
| b. No | 85.7 | (± 4.2) | 86.0 | (± 1.1) |
| 115. Have you ever tried to kill yourself? | Local
(n = 272) | State
(n = 10,815) |
| a. Yes | 2.9% | (± 2.0%) | 4.5% | (± 0.5%) |
| b. No | 97.1 | (± 2.0) | 95.5 | (± 0.5) |
| 116. When you feel sad or hopeless, are there adults you can turn to for help? | Local
(n = 270) | State
(n = 10,767) |
| a. I never feel sad or hopeless | 22.2% | (± 5.0%) | 22.3% | (± 1.0%) |
| b. Yes | 56.7 | (± 5.9) | 57.5 | (± 1.7) |
| c. No | 10.7 | (± 3.7) | 8.7 | (± 0.7) |
| d. Not sure | 10.4 | (± 3.6) | 11.6 | (± 0.8) |
Gambling
[Items 120–121 appear only on the secondary version of the survey.]
School Climate
In the past few years Washington State has given increased attention to supportive learning environments. Students need a safe, nurturing, healthy, and civil learning environment if they are to be successful in school. This section provides information about student perceptions of school climate.
| 122. A student is being bullied when another student, or group of students, say or do nasty or unpleasant things to him or her. It is also bullying when a student is teased repeatedly in a way he or she doesn’t like. It is NOT bullying when two students of about the same strength argue or fight. In the last 30 days, how often have you been bullied? | Local
(n = 272) | State
(n = 10,856) |
| a. I have not been bullied | 74.6% | (± 5.2%) | 69.6% | (± 1.4%) |
| b. Once | 12.5 | (± 3.9) | 15.0 | (± 0.8) |
| c. 2–3 times | 7.7 | (± 3.2) | 7.9 | (± 0.6) |
| d. About once a week | 2.2 | (± 1.7) | 2.2 | (± 0.3) |
| e. Several times a week | 2.9 | (± 2.0) | 5.3 | (± 0.5) |
Quality of Life
Health-related quality of life is an individual’s or group’s perceived physical and mental health over time. At the individual level it involves a person’s health and health-related conditions; at the community level it involves conditions that influence people’s health. This section contains the results of the items related to individual quality of life.
[Items 136–143 appear only on the secondary version of the survey.]
Evergreen Middle School (Everett School District) Grade 6
| 144. Has your parent or guardian served in the military (Army, Navy, Air Force, Marines, Coast Guard, National Guard, and Reserves)? | Local
(n = 274) | State
(n = 11,461) |
| a. No | 71.9% | (± 5.3%) | 65.2% | (± 2.0%) |
| b. Yes | 17.2 | (± 4.5) | 23.2 | (± 2.1) |
| c. Not sure | 11.0 | (± 3.7) | 11.7 | (± 0.9) |
| 146. Do you have goals and plans for the future? | Local
(n = 270) | State
(n = 11,298) |
| a. No | 13.7% | (± 4.1%) | 12.6% | (± 0.9%) |
| b. Yes | 86.3 | (± 4.1) | 87.4 | (± 0.9) |
Risk and Protective Factors
Decades of research have shown that certain risk factors are associated with increased likelihood of health risk behaviors including ATOD use, violence, and delinquent behaviors. Similarly, research has shown that protective factors exert a positive influence against the negative influence of risk factors. The survey included substantial coverage of risk and protective factors based on the work of Drs. Hawkins and Catalano and associates at the University of Washington. The premise of the risk reduction and protective factor enhancement approach to prevention is that preventing a problem before it occurs requires addressing the factors that predict the problem. Ideally, this strategy entails discovering the causes of the problem behavior and influencing those causes. Many of the survey items were used to assess students’ status on risk and protective factors in the community, school, and peer-individual domains. Composite scales were computed for use in local program planning.
The table on the following page provides the complete list of risk and protective factors and indicates the years the Healthy Youth Survey has included each factor.
Evergreen Middle School (Everett School District) Grade 6
Risk and Protective Factor Framework and Reporting Schedule
Healthy Youth Survey Administration Year
|
1995
| 1998
| 2000
| 2002
| 2004
| 2006
| 2008
| 2010
|
| Community Risk Factors |
| Low Neighborhood Attachment | X
| X
| X
| XS | XS
| XS
| XS
|
| Community Disorganization | X
|
| Transitions and Mobility | X
| XS
|
| Perceived Availability of Drugs | X
| X
| X
| X
| X
| X
| X
| X
|
| Perceived Availability of Handguns | X
| X
| X
| XS
| XS
| XS
| XS
| XS
|
| Laws And Norms Favorable to Drug Use | X
| X
| X
| X
| X
| X
| X
| X
|
| Community Protective Factors |
| Opportunities for Prosocial Involvement | X
| X
| XS
| XS
| XS
| XS
|
| Rewards for Prosocial Involvement | X
| X
| X
| X
| X
| X
| X
| XE
|
| Family Risk Factors |
| Family History of Antisocial Behavior | X
|
| Poor Family Management | X
| XS,
†
| XS,
†
| XS,
†
| XS,
†
| XS,
†
|
| Family Conflict |
| Parental Attitudes Favorable towards Drug Use | XS,
†
| XS,
†
| XS
|
| Parental Attitudes Favorable to Antisocial Behavior | X
| XS,
†
|
| Antisocial Behavior Among Familiar Adults | XS
|
| Family Protective Factors |
| Attachment |
| Opportunities for Prosocial Involvement | X
| X
†
| XE,
†
| X
†
| X
†
| X
†
|
| Rewards for Prosocial Involvement | X
| X
†
| XE,
†
| X
†
| X
†
| X
†
|
| School Risk Factors |
| Academic Failure | X
| X
| X
| X
| X
| X
| X
| X
|
| Low Commitment to School | X
| X
| X
| X
| X
| X
| X
| X
|
| School Protective Factors |
| Opportunities for Prosocial Involvement | X
| X
| X
| XS
| XS
| XS
| XS
| XS
|
| Rewards for Prosocial Involvement | X
| X
| X
| X
| X
| X
| X
| X
|
| Peer-Individual Risk Factors |
| Rebelliousness | X
| X
|
| Gang Involvement |
| Perceived Risk of Drug Use | X
| X
| X
| X
| X
| X
| X
|
| Early Initiation of Drug Use | X
| XS
| XS
| XS
| XS
| XS
|
| Early Initiation of Antisocial Behavior | X
| X
| X
| XS
| XS
| XS
| XS
| XS
|
| Favorable Attitudes Towards Drug Use | X
| X
| X
| X
| X
| X
| X
| X
|
| Favorable Attitudes Towards Antisocial Behavior | X
| X
| X
| XS
| XS
| XS
| XS
| XS
|
| Sensation Seeking | X
| X
|
| Rewards for Antisocial Involvement | X
| X
| XS
| XS
| XS
| XS
|
| Friends’ Use of Drugs | X
| X
| X
| XS
| XS
| XS
| XS
| XS
|
| Interaction With Antisocial Peers | X
| X
| XS
| XS
| XS
| XS
|
| Intentions to Use | XS
| XS
| XS
| XS
| XS
|
| Peer-Individual Protective Factors |
| Interaction With Prosocial Peers | X
| X
| X
| XS
|
| Belief in the Moral Order | X
| X
| X
| XS
| XS
| XS
| XS
| XS
|
| Prosocial Involvement | X
| X
| XE
| XE
|
| Rewards for Prosocial Involvement |
| Social Skills | X
| X
| XS
| XS
| XS
| XS
| XS
| XS
|
| Religiosity | X
|
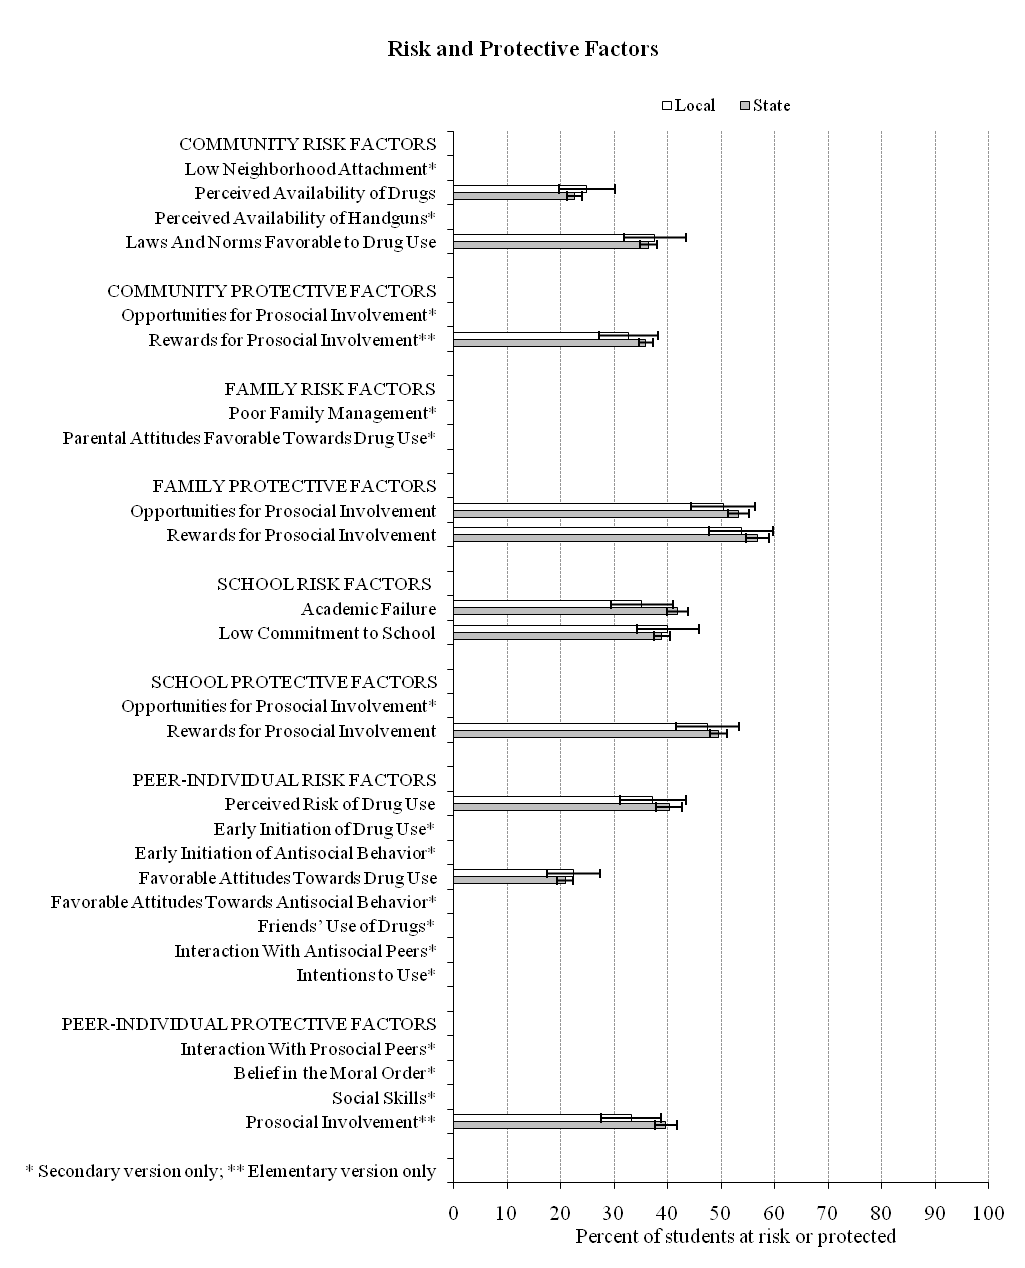
Risk and Protective Factor Scale Results
For each risk factor scale, the percentage of students who are at risk (i.e., who agreed with statements that predict ATOD use or other problem behaviors) is reported; higher percentages indicate that more students are likely to engage in problem behaviors. For each protective factor scale, the percentage of students who are resilient (i.e., who agreed with statements that predict the ability to resist ATOD use or other problem behaviors) is reported; higher percentages indicate that fewer students are likely to engage in problem behaviors. These percentages are based on computational methods provided by the University of Washington’s Social Development Research Group.
| Community Risk Factors | Local
| State
|
(n = 269)
| (n = 10,671)
|
| Perceived Availability of Drugs (Items 150–153) | 24.9% | (± 5.2%) | 22.6% | (± 1.3%) |
(n = 271)
| (n = 11,024)
|
| Laws And Norms Favorable to Drug Use (Items 155–160) | 37.6% | (± 5.8%) | 36.5% | (± 1.6%) |
| Community Protective Factors | Local
| State
|
(n = 275)
| (n = 11,202)
|
| Rewards for Prosocial Involvement (Items 165–167) | 32.7% | (± 5.5%) | 35.9% | (± 1.3%) |
| Family Risk Factors | [Only on the secondary version of the survey.]
|
| Family Protective Factors | Local
| State
|
(n = 270)
| (n = 8,868)
|
| Opportunities for Prosocial Involvement (Items 176–178) | 50.4% | (± 6.0%) | 53.2% | (± 1.9%) |
(n = 268)
| (n = 8,832)
|
| Rewards for Prosocial Involvement (Items 179–182) | 53.7% | (± 6.0%) | 56.8% | (± 2.1%) |
| School Risk Factors | Local
| State
|
(n = 267)
| (n = 10,733)
|
| Academic Failure (Items 186–187) | 35.2% | (± 5.7%) | 41.9% | (± 2.0%) |
(n = 277)
| (n = 11,424)
|
| Low Commitment to School (Items 188–194) | 40.1% | (± 5.8%) | 38.9% | (± 1.5%) |
| School Protective Factors | Local
| State
|
(n = 274)
| (n = 11,335)
|
| Rewards for Prosocial Involvement (Items 200–203) | 47.5% | (± 5.9%) | 49.5% | (± 1.6%) |
| Peer-Individual Risk Factors | Local
| State
|
(n = 239)
| (n = 9,134)
|
| Perceived Risk of Drug Use (Items 204–207) | 37.2% | (± 6.1%) | 40.3% | (± 2.4%) |
(n = 272)
| (n = 10,452)
|
| Favorable Attitudes Towards Drug Use (Items 218–221) | 22.4% | (± 5.0%) | 20.9% | (± 1.5%) |
| Peer-Individual Protective Factors | Local
| State
|
(n = 274)
| (n = 11,195)
|
| Prosocial Involvement (Items 250–252) | 33.2% | (± 5.6%) | 39.7% | (± 2.0%) |
Graph of Scale Results
Risk and Protective Factors: Individual Item Results
The remainder of the report provides results for the individual items used to compute the risk and protective factors.
Community Domain
[Items 147–149 appear only on the secondary version of the survey.]
| 150. If you wanted to get some beer, wine, or hard liquor (for example, vodka, whiskey, or gin), how easy would it be for you to get some? | Local
(n = 269) | State
(n = 10,760) |
| a. Very hard | 68.8% | (± 5.5%) | 69.5% | (± 1.2%) |
| b. Sort of hard | 15.2 | (± 4.3) | 15.6 | (± 0.8) |
| c. Sort of easy | 8.9 | (± 3.4) | 8.2 | (± 0.5) |
| d. Very easy | 7.1 | (± 3.1) | 6.8 | (± 0.5) |
| 151. If you wanted to get some cigarettes, how easy would it be for you to get some? | Local
(n = 270) | State
(n = 10,702) |
| a. Very hard | 66.3% | (± 5.6%) | 71.2% | (± 1.4%) |
| b. Sort of hard | 15.9 | (± 4.4) | 13.5 | (± 0.6) |
| c. Sort of easy | 10.4 | (± 3.6) | 7.9 | (± 0.6) |
| d. Very easy | 7.4 | (± 3.1) | 7.4 | (± 0.7) |
| 152. If you wanted to get some marijuana, how easy would it be for you to get some? | Local
(n = 268) | State
(n = 10,635) |
| a. Very hard | 80.6% | (± 4.7%) | 84.3% | (± 1.4%) |
| b. Sort of hard | 10.8 | (± 3.7) | 7.2 | (± 0.6) |
| c. Sort of easy | 4.1 | (± 2.4) | 4.3 | (± 0.6) |
| d. Very easy | 4.5 | (± 2.5) | 4.3 | (± 0.6) |
| 153. If you wanted to get a drug like cocaine, LSD, or amphetamines, how easy would it be for you to get some? | Local
(n = 267) | State
(n = 10,590) |
| a. Very hard | 88.4% | (± 3.8%) | 87.5% | (± 0.9%) |
| b. Sort of hard | 6.0 | (± 2.8) | 7.1 | (± 0.6) |
| c. Sort of easy | 4.1 | (± 2.4) | 2.8 | (± 0.4) |
| d. Very easy | 1.5 | (± 1.5) | 2.7 | (± 0.4) |
| 155. How wrong would most adults in your neighborhoodC/ neighborhood or communityA think it was for kids your age to use marijuana? | Local
(n = 272) | State
(n = 11,075) |
| a. Very wrong | 79.4% | (± 4.8%) | 83.5% | (± 1.4%) |
| b. Wrong | 14.0 | (± 4.1) | 10.4 | (± 0.8) |
| c. A little bit wrong | 4.0 | (± 2.3) | 3.9 | (± 0.5) |
| d. Not wrong at all | 2.6 | (± 1.9) | 2.2 | (± 0.4) |
| 156. How wrong would most adults in your neighborhoodC/ neighborhood or communityA think it was for kids your age to drink alcohol? | Local
(n = 273) | State
(n = 11,097) |
| a. Very wrong | 78.4% | (± 4.9%) | 78.1% | (± 1.1%) |
| b. Wrong | 15.8 | (± 4.3) | 14.6 | (± 0.7) |
| c. A little bit wrong | 4.0 | (± 2.3) | 5.0 | (± 0.5) |
| d. Not wrong at all | 1.8 | (± 1.6) | 2.2 | (± 0.4) |
| 157. How wrong would most adults in your neighborhoodC/ neighborhood or communityA think it was for kids your age to smoke cigarettes? | Local
(n = 273) | State
(n = 11,098) |
| a. Very wrong | 75.8% | (± 5.1%) | 79.3% | (± 1.1%) |
| b. Wrong | 15.8 | (± 4.3) | 13.3 | (± 0.6) |
| c. A little bit wrong | 6.2 | (± 2.9) | 4.7 | (± 0.5) |
| d. Not wrong at all | 2.2 | (± 1.7) | 2.7 | (± 0.4) |
| 158. If a kid drank some beer, wine, or hard liquor (for example, vodka, whiskey, or gin) in your neighborhoodC/ communityA would he or she be caught by the police? | Local
(n = 270) | State
(n = 10,971) |
| a. NO! | 12.2% | (± 3.9%) | 12.0% | (± 0.8%) |
| b. no | 25.6 | (± 5.2) | 27.0 | (± 1.2) |
| c. yes | 32.2 | (± 5.6) | 32.1 | (± 1.1) |
| d. YES! | 30.0 | (± 5.5) | 29.0 | (± 1.2) |
| 159. If a kid carried a handgun in your neighborhoodC/ communityA would he or she be caught by the police? | Local
(n = 269) | State
(n = 10,990) |
| a. NO! | 7.8% | (± 3.2%) | 8.6% | (± 0.6%) |
| b. no | 13.0 | (± 4.0) | 13.1 | (± 0.8) |
| c. yes | 31.2 | (± 5.5) | 28.5 | (± 1.0) |
| d. YES! | 48.0 | (± 6.0) | 49.9 | (± 1.3) |
| 160. If a kid smoked marijuana in your neighborhoodC/ communityA would he or she be caught by the police? | Local
(n = 271) | State
(n = 10,929) |
| a. NO! | 10.0% | (± 3.6%) | 9.4% | (± 0.8%) |
| b. no | 21.8 | (± 4.9) | 20.0 | (± 1.1) |
| c. yes | 32.5 | (± 5.6) | 33.1 | (± 1.1) |
| d. YES! | 35.8 | (± 5.7) | 37.5 | (± 1.4) |
Which of the following activities for people your age are available in your community?
[Item 162–164 appears only on the secondary version of the survey.]
| 165. My neighbors notice when I am doing a good job and let me know. | Local
(n = 276) | State
(n = 11,205) |
| a. NO! | 42.4% | (± 5.8%) | 40.8% | (± 1.7%) |
| b. no | 34.8 | (± 5.6) | 33.8 | (± 1.3) |
| c. yes | 17.0 | (± 4.4) | 18.8 | (± 0.9) |
| d. YES! | 5.8 | (± 2.8) | 6.7 | (± 0.4) |
| 166. There are people in my neighborhood who encourage me to do my best. | Local
(n = 275) | State
(n = 11,206) |
| a. NO! | 33.1% | (± 5.6%) | 28.7% | (± 1.3%) |
| b. no | 24.0 | (± 5.1) | 27.4 | (± 0.9) |
| c. yes | 31.6 | (± 5.5) | 30.0 | (± 1.1) |
| d. YES! | 11.3 | (± 3.7) | 13.9 | (± 0.7) |
| 167. There are people in my neighborhood who are proud of me when I do something well. | Local
(n = 273) | State
(n = 11,154) |
| a. NO! | 32.6% | (± 5.6%) | 28.0% | (± 1.2%) |
| b. no | 27.5 | (± 5.3) | 28.3 | (± 1.0) |
| c. yes | 29.7 | (± 5.4) | 31.6 | (± 1.2) |
| d. YES! | 10.3 | (± 3.6) | 12.1 | (± 0.7) |
Family Domain
The next set of questions asks about your family. When answering these questions, please think about the people you consider to be your family—parents, stepparents, grandparents, aunts, uncles, etc.
[Items 168–175 appear only on the secondary version of the survey.]
| 176. If I had a personal problem, I could ask my mom or dad for help.† | Local
(n = 267) | State
(n = 8,838) |
| a. NO! | 5.2% | (± 2.7%) | 6.4% | (± 0.6%) |
| b. no | 6.4 | (± 2.9) | 7.1 | (± 0.7) |
| c. yes | 33.3 | (± 5.7) | 29.4 | (± 1.1) |
| d. YES! | 55.1 | (± 6.0) | 57.1 | (± 1.7) |
| 177. My parents give me lots of chances to do fun things with them.† | Local
(n = 270) | State
(n = 8,939) |
| a. NO! | 5.6% | (± 2.7%) | 5.8% | (± 0.6%) |
| b. no | 10.7 | (± 3.7) | 12.3 | (± 0.9) |
| c. yes | 43.7 | (± 5.9) | 39.9 | (± 1.1) |
| d. YES! | 40.0 | (± 5.8) | 42.0 | (± 1.5) |
| 178. My parents ask me what I think before most family decisions affecting me are made.† | Local
(n = 267) | State
(n = 8,675) |
| a. NO! | 12.0% | (± 3.9%) | 10.8% | (± 1.0%) |
| b. no | 16.5 | (± 4.4) | 19.6 | (± 1.0) |
| c. yes | 42.7 | (± 5.9) | 39.2 | (± 1.1) |
| d. YES! | 28.8 | (± 5.4) | 30.4 | (± 1.6) |
| 179. My parents notice when I am doing a good job and let me know about it.† | Local
(n = 269) | State
(n = 8,835) |
| a. Never or almost never | 4.8% | (± 2.6%) | 6.4% | (± 0.7%) |
| b. Sometimes | 16.7 | (± 4.5) | 20.1 | (± 1.5) |
| c. Often | 31.6 | (± 5.5) | 28.5 | (± 1.2) |
| d. All the time | 46.8 | (± 6.0) | 44.9 | (± 1.5) |
| 180. How often do your parents tell you they’re proud of you for something you’ve done?† | Local
(n = 269) | State
(n = 8,820) |
| a. Never or almost never | 4.5% | (± 2.5%) | 5.4% | (± 0.6%) |
| b. Sometimes | 16.4 | (± 4.4) | 17.4 | (± 1.3) |
| c. Often | 32.0 | (± 5.6) | 31.5 | (± 1.2) |
| d. All the time | 47.2 | (± 6.0) | 45.7 | (± 1.5) |
| 181. Do you enjoy spending time with your momC/motherA?† | Local
(n = 264) | State
(n = 8,816) |
| a. NO! | 3.0% | (± 2.1%) | 2.5% | (± 0.4%) |
| b. no | 4.2 | (± 2.4) | 3.1 | (± 0.5) |
| c. yes | 26.9 | (± 5.4) | 24.4 | (± 1.1) |
| d. YES! | 65.9 | (± 5.7) | 70.0 | (± 1.4) |
| 182. Do you enjoy spending time with your dadC/fatherA?† | Local
(n = 262) | State
(n = 8,674) |
| a. NO! | 6.9% | (± 3.1%) | 5.5% | (± 0.6%) |
| b. no | 6.9 | (± 3.1) | 4.4 | (± 0.5) |
| c. yes | 28.2 | (± 5.4) | 25.0 | (± 1.1) |
| d. YES! | 58.0 | (± 6.0) | 65.1 | (± 1.8) |
School Domain
| 186. Putting them all together, what were your grades like last year? | Local
(n = 272) | State
(n = 11,056) |
| a. Mostly As | 32.7% | (± 5.6%) | 41.8% | (± 2.7%) |
| b. Mostly Bs | 52.2 | (± 5.9) | 41.0 | (± 1.8) |
| c. Mostly Cs | 11.8 | (± 3.8) | 13.1 | (± 1.2) |
| d. Mostly Ds | 2.6 | (± 1.9) | 2.7 | (± 0.4) |
| e. Mostly Fs | 0.7 | (± 1.0) | 1.5 | (± 0.4) |
| 187. Are your school grades better than the grades of most students in your class? | Local
(n = 271) | State
(n = 11,059) |
| a. NO! | 5.5% | (± 2.7%) | 5.9% | (± 0.7%) |
| b. no | 25.8 | (± 5.2) | 31.7 | (± 1.3) |
| c. yes | 54.6 | (± 5.9) | 50.1 | (± 1.6) |
| d. YES! | 14.0 | (± 4.1) | 12.3 | (± 0.8) |
| 188. How often do you feel the schoolwork you are assigned is meaningful and important? | Local
(n = 273) | State
(n = 11,308) |
| a. Almost always | 29.7% | (± 5.4%) | 32.4% | (± 1.4%) |
| b. Often | 34.4 | (± 5.6) | 27.0 | (± 1.1) |
| c. Sometimes | 25.3 | (± 5.2) | 27.7 | (± 1.1) |
| d. Seldom | 6.6 | (± 2.9) | 8.2 | (± 0.6) |
| e. Never | 4.0 | (± 2.3) | 4.7 | (± 0.5) |
| 189. How interesting are most of your courses to you? | Local
(n = 274) | State
(n = 11,067) |
| a. Very interesting and stimulating | 11.7% | (± 3.8%) | 16.8% | (± 1.4%) |
| b. Quite interesting | 39.1 | (± 5.8) | 36.0 | (± 1.3) |
| c. Fairly interesting | 32.9 | (± 5.6) | 31.7 | (± 1.3) |
| d. Slightly dull | 12.8 | (± 4.0) | 10.6 | (± 0.8) |
| e. Very dull | 3.7 | (± 2.2) | 4.9 | (± 0.5) |
| 190. How important do you think the things you are learning in school are going to be for you later in life? | Local
(n = 277) | State
(n = 11,339) |
| a. Very important | 58.1% | (± 5.8%) | 56.6% | (± 2.0%) |
| b. Quite important | 26.4 | (± 5.2) | 25.8 | (± 1.1) |
| c. Fairly important | 9.4 | (± 3.4) | 11.4 | (± 0.9) |
| d. Slightly important | 5.8 | (± 2.7) | 4.6 | (± 0.5) |
| e. Not at all important | 0.4 | (± 0.7) | 1.7 | (± 0.3) |
Think back over the past year in school. How often did you:
| 191. Enjoy being in school? | Local
(n = 276) | State
(n = 11,511) |
| a. Never | 8.3% | (± 3.3%) | 6.8% | (± 0.6%) |
| b. Seldom | 6.9 | (± 3.0) | 5.3 | (± 0.4) |
| c. Sometimes | 34.1 | (± 5.6) | 30.9 | (± 1.3) |
| d. Often | 22.8 | (± 5.0) | 24.6 | (± 1.2) |
| e. Almost always | 27.9 | (± 5.3) | 32.5 | (± 1.4) |
| 192. Hate being in school? | Local
(n = 274) | State
(n = 11,424) |
| a. Never | 20.8% | (± 4.8%) | 24.3% | (± 1.1%) |
| b. Seldom | 22.3 | (± 4.9) | 23.8 | (± 1.7) |
| c. Sometimes | 41.2 | (± 5.8) | 37.1 | (± 1.4) |
| d. Often | 6.9 | (± 3.0) | 7.8 | (± 0.6) |
| e. Almost always | 8.8 | (± 3.4) | 7.0 | (± 0.6) |
| 193. Try to do your best work in school? | Local
(n = 275) | State
(n = 11,384) |
| a. Never | 1.8% | (± 1.6%) | 1.7% | (± 0.3%) |
| b. Seldom | 2.6 | (± 1.9) | 1.1 | (± 0.2) |
| c. Sometimes | 4.0 | (± 2.3) | 6.2 | (± 0.8) |
| d. Often | 18.6 | (± 4.6) | 18.1 | (± 0.9) |
| e. Almost always | 73.1 | (± 5.2) | 72.9 | (± 1.5) |
| 194. During the LAST 4 WEEKS, how many whole days of school have you missed because you skipped or “cut”? | Local
(n = 276) | State
(n = 11,437) |
| a. None | 81.9% | (± 4.5%) | 82.6% | (± 1.1%) |
| b. 1 | 9.8 | (± 3.5) | 8.4 | (± 0.5) |
| c. 2 | 3.6 | (± 2.2) | 3.7 | (± 0.4) |
| d. 3 | 2.5 | (± 1.9) | 2.2 | (± 0.4) |
| e. 4–5 | 1.5 | (± 1.4) | 1.8 | (± 0.3) |
| f. 6–10 | 0.4 | (± 0.7) | 0.7 | (± 0.1) |
| g. 11 or more | 0.4 | (± 0.7) | 0.6 | (± 0.1) |
| 200. My teacher(s) notices when I am doing a good job and lets me know about it. | Local
(n = 274) | State
(n = 11,365) |
| a. NO! | 5.8% | (± 2.8%) | 6.5% | (± 0.6%) |
| b. no | 18.6 | (± 4.6) | 17.0 | (± 1.0) |
| c. yes | 54.0 | (± 5.9) | 52.5 | (± 1.1) |
| d. YES! | 21.5 | (± 4.9) | 24.0 | (± 1.2) |
| 201. The school lets my parents know when I have done something well. | Local
(n = 271) | State
(n = 11,248) |
| a. NO! | 15.1% | (± 4.3%) | 15.6% | (± 0.8%) |
| b. no | 33.6 | (± 5.6) | 34.7 | (± 1.3) |
| c. yes | 39.1 | (± 5.8) | 35.1 | (± 1.2) |
| d. YES! | 12.2 | (± 3.9) | 14.7 | (± 0.8) |
| 202. I feel safe at my school. | Local
(n = 276) | State
(n = 11,356) |
| a. NO!A,C / Definitely NOT trueB | 1.1% | (± 1.2%) | 4.1% | (± 0.5%) |
| b. noA,C / Mostly not trueB | 6.2 | (± 2.8) | 9.1 | (± 0.8) |
| c. yesA,C / Mostly trueB | 45.7 | (± 5.9) | 46.6 | (± 1.5) |
| d. YES! A,C / Definitely trueB | 47.1 | (± 5.9) | 40.2 | (± 2.1) |
| 203. My teachers praise me when I work hard in school. | Local
(n = 270) | State
(n = 11,035) |
| a. NO! | 12.6% | (± 4.0%) | 12.4% | (± 0.8%) |
| b. no | 33.3 | (± 5.6) | 29.6 | (± 1.3) |
| c. yes | 41.5 | (± 5.9) | 44.0 | (± 1.3) |
| d. YES! | 12.6 | (± 4.0) | 14.0 | (± 0.9) |
Peer and Individual Domain
How much do you think people risk harming themselves if they:
| 204. Smoke one or more packs of cigarettes per day? | Local
(n = 271) | State
(n = 10,575) |
| a. No risk | 8.1% | (± 3.3%) | 8.7% | (± 1.2%) |
| b. Slight risk | 3.0 | (± 2.0) | 4.5 | (± 0.4) |
| c. Moderate risk | 12.2 | (± 3.9) | 13.4 | (± 0.7) |
| d. Great risk | 65.3 | (± 5.7) | 61.3 | (± 2.4) |
| e. Not sure | 11.4 | (± 3.8) | 12.2 | (± 1.3) |
| 205. Try marijuana once or twice? | Local
(n = 271) | State
(n = 10,520) |
| a. No risk | 11.1% | (± 3.7%) | 13.5% | (± 1.6%) |
| b. Slight risk | 16.6 | (± 4.4) | 16.2 | (± 0.9) |
| c. Moderate risk | 21.8 | (± 4.9) | 22.2 | (± 1.3) |
| d. Great risk | 38.4 | (± 5.8) | 34.7 | (± 1.6) |
| e. Not sure | 12.2 | (± 3.9) | 13.4 | (± 1.0) |
| 206. Smoke marijuana regularly (at least once or twice a week)? | Local
(n = 271) | State
(n = 10,479) |
| a. No risk | 11.1% | (± 3.7%) | 12.2% | (± 1.6%) |
| b. Slight risk | 8.9 | (± 3.4) | 8.2 | (± 0.6) |
| c. Moderate risk | 19.6 | (± 4.7) | 17.4 | (± 0.7) |
| d. Great risk | 47.2 | (± 5.9) | 49.5 | (± 2.8) |
| e. Not sure | 13.3 | (± 4.0) | 12.8 | (± 1.0) |
| 207. Take one or two drinks of an alcoholic beverage (wine, beer, a shot, liquor) nearly every day? | Local
(n = 270) | State
(n = 10,494) |
| a. No risk | 12.6% | (± 4.0%) | 15.3% | (± 1.4%) |
| b. Slight risk | 18.9 | (± 4.7) | 18.3 | (± 0.8) |
| c. Moderate risk | 26.3 | (± 5.3) | 23.9 | (± 1.2) |
| d. Great risk | 31.9 | (± 5.6) | 30.8 | (± 1.5) |
| e. Not sure | 10.4 | (± 3.6) | 11.7 | (± 0.8) |
| 209. Have you ever, even once in your lifetime smoked marijuana? | Local
(n = 273) | State
(n = 10,982) |
| a. Yes | 5.1% | (± 2.6%) | 3.9% | (± 0.6%) |
| b. No | 94.9 | (± 2.6) | 96.1 | (± 0.6) |
| 212. Have you ever, even once in your lifetime had more than a sip or two of beer, wine, or hard liquor (for example, vodka, whiskey, or gin)? | Local
(n = 273) | State
(n = 10,970) |
| a. Yes | 24.2% | (± 5.1%) | 26.3% | (± 1.2%) |
| b. No | 75.8 | (± 5.1) | 73.7 | (± 1.2) |
How wrong do you think it is for someone your age to:
| 218. Drink beer, wine, or hard liquor (for example, vodka, whiskey, or gin) regularly? | Local
(n = 272) | State
(n = 10,494) |
| a. Very wrong | 83.1% | (± 4.4%) | 83.4% | (± 1.2%) |
| b. Wrong | 12.1 | (± 3.9) | 11.3 | (± 0.8) |
| c. A little bit wrong | 2.9 | (± 2.0) | 4.0 | (± 0.5) |
| d. Not wrong at all | 1.8 | (± 1.6) | 1.3 | (± 0.2) |
| 219. Smoke cigarettes? | Local
(n = 271) | State
(n = 10,463) |
| a. Very wrong | 85.2% | (± 4.2%) | 87.1% | (± 1.2%) |
| b. Wrong | 11.1 | (± 3.7) | 9.6 | (± 0.9) |
| c. A little bit wrong | 2.2 | (± 1.7) | 2.3 | (± 0.4) |
| d. Not wrong at all | 1.5 | (± 1.4) | 1.0 | (± 0.2) |
| 220. Smoke marijuana? | Local
(n = 271) | State
(n = 10,429) |
| a. Very wrong | 88.9% | (± 3.7%) | 91.5% | (± 1.1%) |
| b. Wrong | 6.6 | (± 3.0) | 5.7 | (± 0.7) |
| c. A little bit wrong | 3.0 | (± 2.0) | 1.8 | (± 0.4) |
| d. Not wrong at all | 1.5 | (± 1.4) | 1.1 | (± 0.3) |
| 221. Use LSD, cocaine, amphetamines, or another illegal drug? | Local
(n = 272) | State
(n = 10,424) |
| a. Very wrong | 93.0% | (± 3.0%) | 93.7% | (± 0.7%) |
| b. Wrong | 3.3 | (± 2.1) | 3.9 | (± 0.5) |
| c. A little bit wrong | 2.2 | (± 1.7) | 1.0 | (± 0.2) |
| d. Not wrong at all | 1.5 | (± 1.4) | 1.4 | (± 0.2) |
How many times in the past year (12 months) have you . . .
| 250. Participated in clubs, organizations or activities at school? | Local
(n = 274) | State
(n = 11,209) |
| a. Never | 29.2% | (± 5.4%) | 26.9% | (± 1.9%) |
| b. 1 or 2 times | 30.7 | (± 5.5) | 30.5 | (± 0.9) |
| c. 3 to 5 times | 18.3 | (± 4.6) | 17.5 | (± 0.9) |
| d. 6 to 9 times | 7.3 | (± 3.1) | 8.6 | (± 0.5) |
| e. 10 to 19 times | 5.8 | (± 2.8) | 5.9 | (± 0.5) |
| f. 20 to 29 times | 3.3 | (± 2.1) | 2.8 | (± 0.3) |
| g. 30 to 39 times | 1.8 | (± 1.6) | 1.7 | (± 0.2) |
| h. 40+ times | 3.7 | (± 2.2) | 6.2 | (± 0.6) |
| 251. Done extra work on your own for school? | Local
(n = 274) | State
(n = 11,162) |
| a. Never | 27.7% | (± 5.3%) | 25.2% | (± 1.4%) |
| b. 1 or 2 times | 33.9 | (± 5.6) | 31.8 | (± 0.9) |
| c. 3 to 5 times | 16.4 | (± 4.4) | 16.9 | (± 0.8) |
| d. 6 to 9 times | 9.9 | (± 3.5) | 10.4 | (± 0.6) |
| e. 10 to 19 times | 4.7 | (± 2.5) | 6.7 | (± 0.6) |
| f. 20 to 29 times | 2.9 | (± 2.0) | 3.1 | (± 0.3) |
| g. 30 to 39 times | 1.5 | (± 1.4) | 1.7 | (± 0.3) |
| h. 40+ times | 2.9 | (± 2.0) | 4.2 | (± 0.5) |
| 252. Volunteered to do community service? | Local
(n = 272) | State
(n = 11,077) |
| a. Never | 61.8% | (± 5.8%) | 54.5% | (± 2.4%) |
| b. 1 or 2 times | 22.4 | (± 5.0) | 22.9 | (± 1.1) |
| c. 3 to 5 times | 7.4 | (± 3.1) | 9.6 | (± 0.8) |
| d. 6 to 9 times | 2.2 | (± 1.7) | 5.1 | (± 0.5) |
| e. 10 to 19 times | 3.3 | (± 2.1) | 3.1 | (± 0.4) |
| f. 20 to 29 times | 0.4 | (± 0.7) | 1.5 | (± 0.3) |
| g. 30 to 39 times | 1.1 | (± 1.2) | 0.8 | (± 0.2) |
| h. 40+ times | 1.5 | (± 1.4) | 2.5 | (± 0.4) |
Item Index
| Alcohol
Attitudes 156, 158, 218 Prevention 52 Source, 150 Use 16, 28, 55, 58, 212 Asthma 79–80 Bullying 122 Clubs 250 Cocaine (see Drugs) Demographics 2–4, 6 Dental Health 85 Depression 116 Drugs Cocaine 153, 221 Marijuana 17, 29, 152, 155, 160, 209, 220 Other drugs 18, 23, 153, 221 | Family 176–182
Fighting 103 Fitness Exercise 71–73 Goals 146 Guns (see Weapons) Honesty 14 Marijuana (see Drugs) Neighborhood 165–167 Nutrition 65, 67–68 Risk of harm 37, 204-207 Safety 94, 96, 98 School Absence 194 Achievement 186–187, 193 Climate 200–201, 203 | School (continued)
Enjoyment 191–192 Safety 202 Schoolwork 188–190, 251 Weapons at 101 Suicide 114, 115 Teams (see Clubs) Tobacco Attitudes 219 Chewing 25 Cigarettes 24, 34–37, 157 Prevention 38, 46 Secondhand smoke 41, 43, 45 Source 151 Volunteer 252 Weapons 101, 159 |