Mathematical Emphasis
Investigation 1
* Identifying and describing attributes
of various materials
* Using an attribute as a basics for
sorting and categorizing a variety of
objects
* Developing strategies to guess
someone else’s sorting rule
* Creating representations of sorted
sets of objects
Investigation 2
* Make a plan for gathering and
recording data
* Sorting and categorizing data
* Inventing and constructing data
representations
* Explaining and interpreting results
of surveys
* Presenting data to others in a way
that communicates information clearly
Investigation 3
* Becoming familiar with calendar
features
* Grouping and describing data about
birthdays
* Ordering data about birthdays
Tips for Helping at Home
•
Have your child help with sorting activi-
ties such as the laundry, items for recy-
cling, groceries, hardware, and spare
change.
•
If your child collects something, you
might work together to organize or sort
the collection.
•
When children are gathering data about
ages of people in their families, talk with
them about who’s older than they are,
and by how much. Encourage your child
to figure out different strategies for com-
paring or adding up.
Collecting and Sorting Data
How to help when your student gets
stuck. . .
•
What do you need to find out?
Student should be specific.
•
What information do you have?
•
What strategies are you going to
use?
•
Does that make sense?
•
How do you know?
•
How did you get answer?
•
Does your answer seem reasonable?
•
What else is there to do?
Survey Questions
and
Back to top
Secret Rules
Websites
http://cms.everett.K12.wa.us/math
http://mathforum.org/students/
www.rainforestmaths.com—data
First Grade
What is a representation?
It’s a form of communication that students need
to learn as a part of data analysis; put simply, in
the words of one student, “It shows the data.”
There are standard forms of data representation:
charts, tallies, line plots and bar graphs. There
are also many unusual forms of graph and dia-
grams.
So, how do students “show the data”? For the
activities in this unit, we encourage students to
invent their own methods. When students invent
their own ways of representing their data they
often come up with wonderfully individual pictures
or graphs that powerfully communicate the mean-
ing of data.
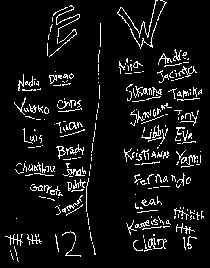
Shown below are some ways that first graders
have represented their findings from Would You
Rather Be an Eagle or a Whale? None of these
follow a standard graph form but both show the
data clearly and effectively.
Wright, Tracey. Investigations in Number, Data, and Space: Survey Questions
and Secret Rules. Dale Seymour, 1998.
Vocabulary
•
sorting—putting items into like
groups
•
similar—an attribu te that is alike
in 2 or more objects
•
differences—an attribute which
is different from others
•
attributes—characteristics of
an object
•
more than
•
less than
Game
Back to top
On and Off
Materials:
Counters (8—12)
On and Off game grid
Sheet of paper
Players:
1—3
Object:
Toss counters over a sheet
of paper. Record how many
land on and off the paper.
How to Play:
1. Decide how many counters you will toss
each time. Write this number on the game
grid.
2. Lay the sheet of paper on a flat surface.
3. Hold the counters in one hand and toss
them over the paper.
4. On the game grid, write how many landed
on the paper and off the paper.
5. Repeat steps 3 and 4 until you have filled
the game grid. (Take eight tosses.)
Optional: Your filled game grid shows differ-
ent ways to break the total number into two
parts. Can you find a way that is not shown?
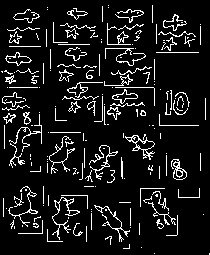
On and Off Game Grid
Total Number ______
Online Glossary
http://www.amathsdictionaryforkids.com/
On
Off
Back to top