Grade 4
Tips for Helping at Home
•
Questions to ask:
What is it that you don’t understand (have
the student be specific)?
What about putting things in order?
Could you try it with simpler numbers?
Can you guess and check?
Does this make sense?
What can you do to explain your answer to
show others what you are thinking?
Does your answer seem reasonable?
•
It can be easy for you to become involved in this
unit, because your child may ask you questions
as part of his/her data collection activities. Give
your full attention to these questions and help
your child record your answers, as they will be
the basis for work in the class.
•
You will find that there are many opportunities to
collect data around your home. Which color or
make of car is the most common on your street?
Why might that be? Do more households in your
neighborhood have a dog or a cat? After a while,
collecting and thinking about data may become a
habit that you and your child share.
Mathematical Emphasis
Investigation 1—Introduction to Data Analysis
•
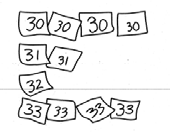
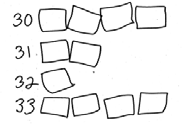
Making quick sketches of the data to use as work-
ing tools during the analysis process
•
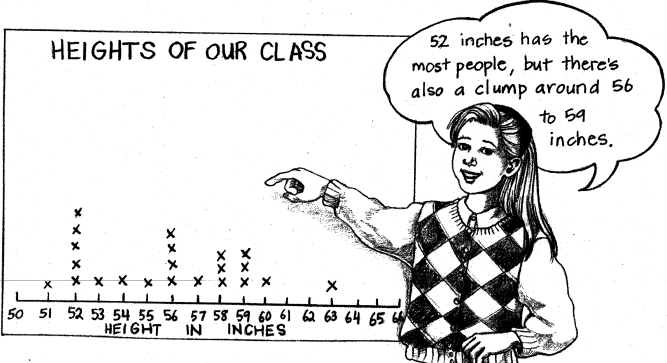
Describing the shape of the data, moving from no-
ticing individual features of the data to describing
the overall shape of the distribution
•
Defining the way data will be collected
•
Summarizing what is typical of a set of data
Investigation 2—Landmarks in the Data
•
Inventing ways to compare and represent two sets
of data by describing the shape of the data and
what’s typical of the data
•
Finding the median in a set of data arranged in
numerical order
•
Finding the median in a set of data grouped by
frequency
•
Using the median to describe a set of data and to
compare one data set to another
Websites
Back to top
http://cms.everett.k12.wa.us/math
Back to top
http://www.hazelwood.k12.mo.us/~c
davis01/map2000/4th/math18.ppt
Statistics
Representing the Data
In this book, students will be working on gathering,
organizing, and representing data about a variety of
subjects. During this process, they will be developing
skills in creating and using two main types of graphs:
sketch graphs and presentation graphs.
Sketch graphs
are a type of graph students make
and use just to help uncover the story of the data.
This type of working graph need not be shown to
anyone else. Sketch graphs do not require neatness,
careful measurement or scaling , use of clear titles or
labels, or decorative work.
Presentation graphs
are meant to be seen by an
audience. Their purpose is to be present an organ-
ized, clear, and accessible display of the data.
Vocabulary
Axis:
one of the reference lines on a coordi-
nate graph
X-axis:
the horizontal axis on a coordinate
grid
Y-axis:
the vertical axis on a coordinate grid
Median:
a way to average counts or meas-
ures when there are extremes in the data. The
middle point of the ordered group is found.
Mode:
a way to average data when there are
many identical data points. The mode is the
data that appears the most often.
Data:
information
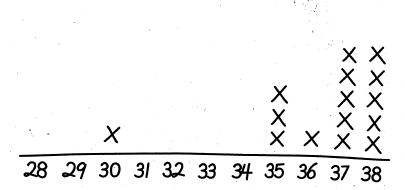
Line plot:
A line plot consists of a horizontal
number line, on which each value of a set is
denoted by an x over the corresponding value
on the number line. The number of x's above
each score indicates how many times each
score occurred.
Glossary
http://www.amathsdictionaryforkids.com/
99 and Out
Materials
•
2 number cubes (1-6) or spinners
•
Scratch paper and pencil for each player
Directions
1. The first player rolls the two number cubes to
forma two-digit number and subtracts this num-
ber from 99. For example, if the player rolled a 2
and a 4, he would make a 24 and subtract 24
from 99. The player records the difference.
2. Each other player, in turn, rolls the number
cubes, forms a new two-digit number, and sub-
tracts it from 99.
3. For the second turn, each player rolls the num-
ber cubes, forms a new two-digit number, and
subtracts it from the existing difference.
4. For succeeding turns, players decide if they
want to subtract a 2-digit or one-digit number
and then roll the appropriate quantity of number
cubes.
5. Players continue rolling and subtracting until a
player reaches zero or close to it. Players who
roll a number higher than the remaining differ-
ence automatically lose that round.
6. The player with the lowest difference wins.
Russell, S. Investigations in Number, Data and Space: The
Shape of Data. Dale Seymour, 1998.